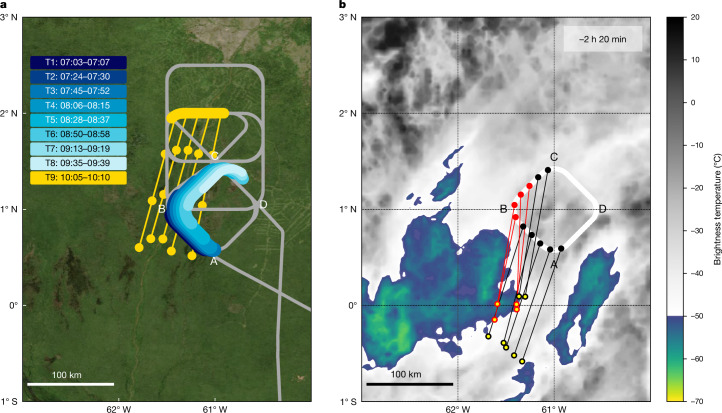
Fig. 2. Flight path and air-mass back trajectories.
a, Flight path for RF 19 (grey). The diamond-shaped pattern ABCD was flown repeatedly and the NPF air mass was encountered several times (thick-coloured sections T4–T9) also before the NPF event started (T1–T3). Coloured sections T1–T8 are each slightly shifted to the right to prevent overlap. Thin yellow lines with 1-h markers indicate 3 h of back trajectories from the NPF period T9 used to calculate and identify periods T1–T8. b, Back trajectories from the locations of the aircraft between 08:05 and 08:15 local time (black and red markers) to 140 min before (yellow-centred markers) and infrared satellite image (GOES-16, band 13: 10.3 µm; https://ftp.cptec.inpe.br/goes/goes16/retangular/ch13/2023/01/) indicating the approximate cloud-top temperatures at 05:50 local time. Temperatures below −50 °C are coloured. The back-trajectory calculations used the horizontal wind speed and direction measured by the research aircraft. The air parcels in which NPF was detected (red circles) trace back to the convective cloud and were in contact with convection more recently (relative to the sampling time) than those in which NPF was not detected (black circles). Satellite picture data in a obtained from https://wvs.earthdata.nasa.gov, NASA Worldview Snapshots.

