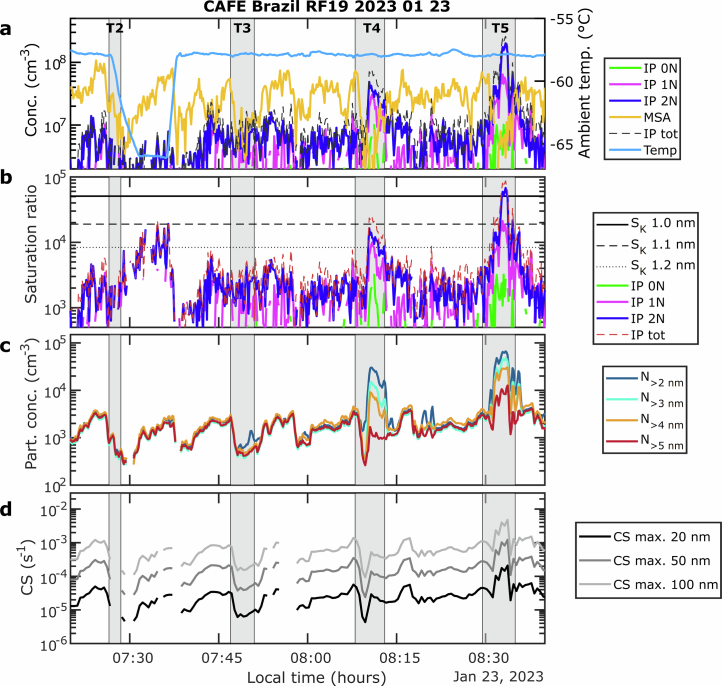
Extended Data Fig. 3. Details of NPF event during RF 19.
a, IP0N, IP1N and IP2N measured with the CI-APi-TOF mass spectrometer as well as IP0-2N = IP0N + IP1N + IP2N and MSA. b, Calculated saturation ratio for IP0N, IP1N and IP2N, as well as estimated saturation ratio necessary to overcome the Kelvin barrier for particle diameters of 1.0, 1.1 and 1.2 nm, respectively (Methods). c, Particle concentrations N2, N3, N4 and N5 as measured by four channels of the FASD instrument. d, Estimated maximum of the CS when assuming all particles N5 to have maximum sizes of 20, 50 or 100 nm. During T3, when NPF is first observed by the initial increase of N2, the CS is less than 2 × 10⁻⁴ s−1.

