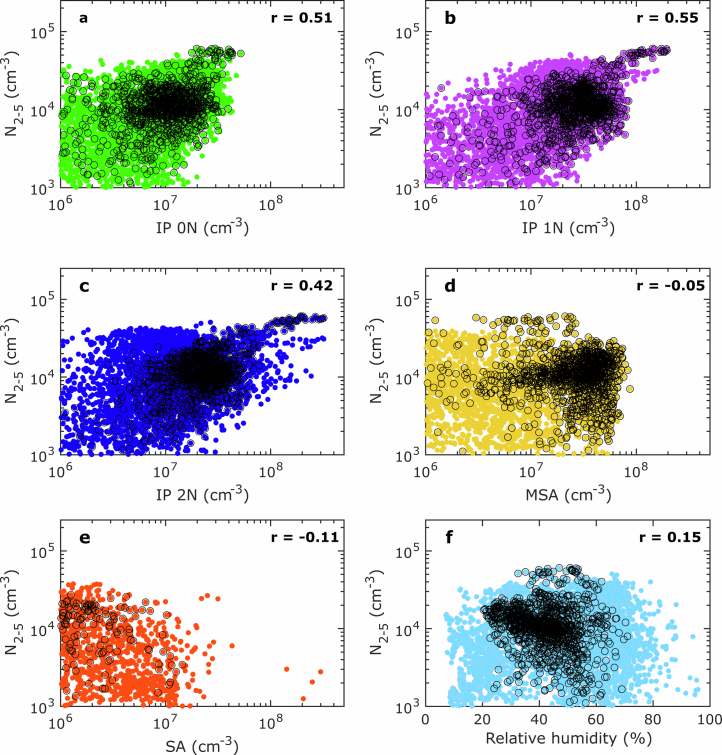
Extended Data Fig. 4. Correlation of N2–5 particle concentration with trace gases.
Correlation of N2–5 with IP0N (a), IP1N (b), IP2N (c), MSA (d), sulfuric acid (e) and relative humidity (f). Coloured data represent research flights RF 09 to RF 20, excluding RF 16, and for RF 17, channel N2 is replaced by N3 for technical reasons. Only data during NPF events measured between 08:00 and 18:00 local time (LT) and for altitudes >8 km are shown (see Fig. 4 and Extended Data Fig. 8). Data points with black circles represent RF 19. Correlation coefficients represent the entire dataset.

