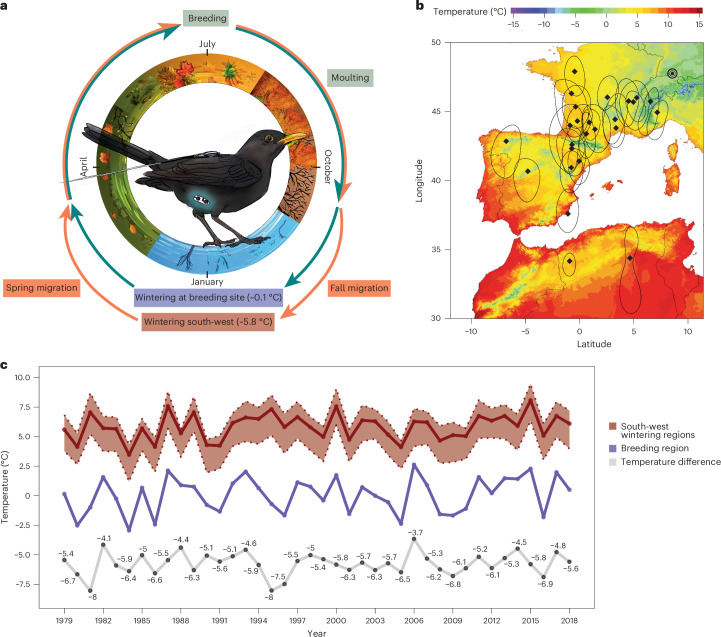
Fig. 1. Study system and temperature conditions.
a, Illustration of the experimental setup with a common blackbird (Turdus merula) carrying a radio transmitter backpack and an implanted fH and temperature logger. The surrounding seasonal cycle highlights the main phases during the year for both wintering strategies. b, Temperature map for south-west Europe with known breeding and wintering sites of previously studied migratory blackbirds (N = 25) of the same population as the birds in the current study. The temperature gradient represents the mean Ta during December and January in south-west Europe. The black triple circle depicts the breeding site and single black diamonds and black outlines (25% kernel utilization distribution) represent the centroid of wintering sites estimated by using geolocators of blackbirds from the same breeding area from a previous study14. c, Comparison of temperatures between wintering sites and breeding site during winter. The mean Ta during winter (3 December to 17 January) at wintering sites (red, including the lower 25th and upper 75th quantiles) and at the breeding site (blue) over 39 years. The grey line underneath represents the mean temperature difference and calculated value between both location types.

