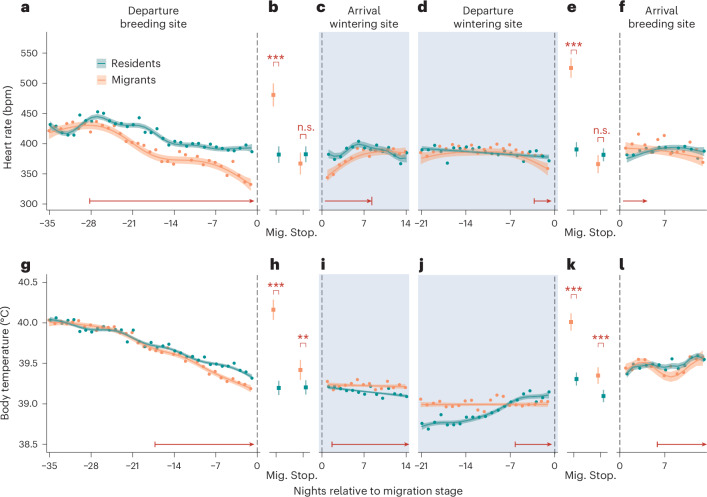
Fig. 3. fH and Tb in different stages relative to migration.
a–f, Mean fH (a–e) and Tb (g–l) in seperate chronological stages in relation to migration, are shown as points during night across all migrants (orange) and all residents (dark green) centred on departure date from breeding site relative to initial departure (a and g), migration (Mig.) and stopover (Stop.) (b and h) in fall, centred on arrival date in wintering site (c and i), centred on departure date from wintering site relative to spring departure (d and j), migration and stopover in spring (e and k) and centred on arrival date on breeding site (f and l). For all measurements over time (a, c, d, f, g and i–l), the vertical dashed line marks the point of reference, while each single point represents the mean value across each overwintering strategy, with migrants centred and residents correspondingly assigned (Methods). The coloured solid line shows predicted fH and Tb values for each strategy derived from a GAMM, including individual measurements for each bird (Supplementary Tables 2–7 and Supplementary Results). Correspondingly coloured ribbons show the 95% confidence interval of those predictions. The blue-marked periods highlight the time when migratory birds reside in their final wintering grounds. The horizontal red arrows mark the first and last times when measures significantly differ between strategies. For migration stage-centred comparisons via linear mixed models (b, e, h and k), the means are shown as coloured squares with standard error bars. Bonferroni corrected statistical significance levels: ***P < 0.001, **P < 0.01, *P < 0.05 and ‘non-significant (n.s.)’ where P > 0.05.

