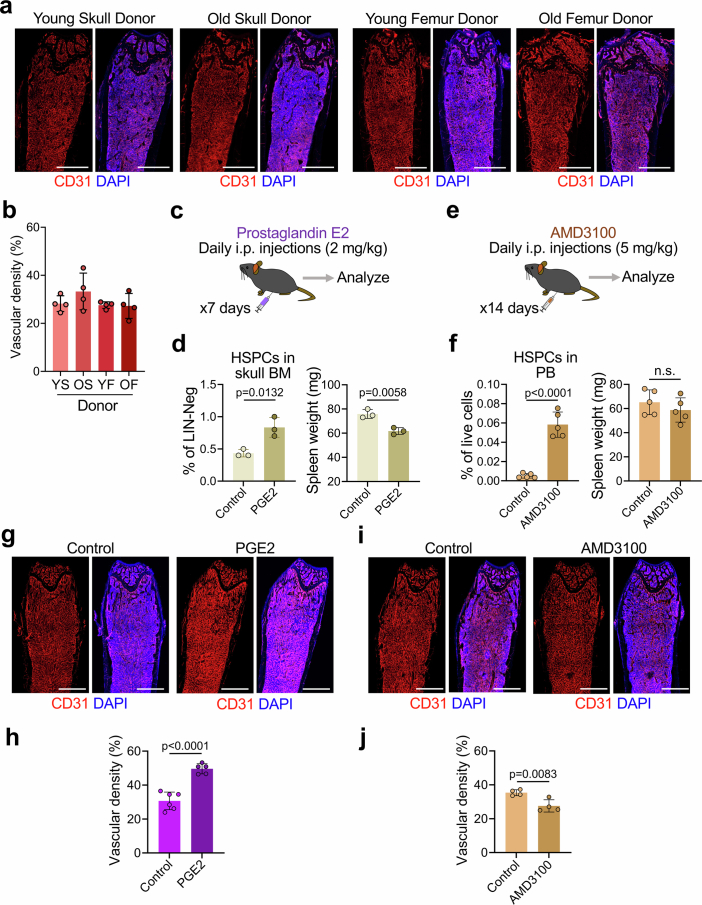
Extended Data Fig. 7. Effect of treatments affecting HSPCs.
a, b. In vivo IF staining (a) and quantification (b) of femoral BM blood vessels in recipient mice receiving hematopoietic lineage-negative cells isolated from young or old donors (young skull (YS), old skull (OS), young femur (YF), old femur (OF)). n = 4 mice/group from three independent experiments. Scale bars, 1 mm. c, d. Diagram showing experimental scheme for PGE2 treatment for HSPC expansion (c) and quantification (d) of HSPCs in skull BM and spleen weight with PGE2 treatment (n = 3 mice/group from three independent experiments). e, f. Diagram showing experimental scheme for AMD3100 treatment for HSPC mobilization (e) and quantification (f) of HSPCs in peripheral blood and spleen weight with AMD3100 treatment (n = 5 mice/group from three independent experiments). g-j. In vivo IF staining (g, i) and quantification (h, j) of femoral BM blood vessels in mice treated with PGE2 (g, h) or AMD3100 (i, j) for HSPC expansion or mobilization, respectively. n = 6 (PGE2 Control), n = 5 (PGE2), n = 4 (all other groups) mice/group from three independent experiments. Scale bars, 1 mm. Vertical bars indicate mean ± SD. P values were calculated using two-tailed unpaired Student’s t-test.

