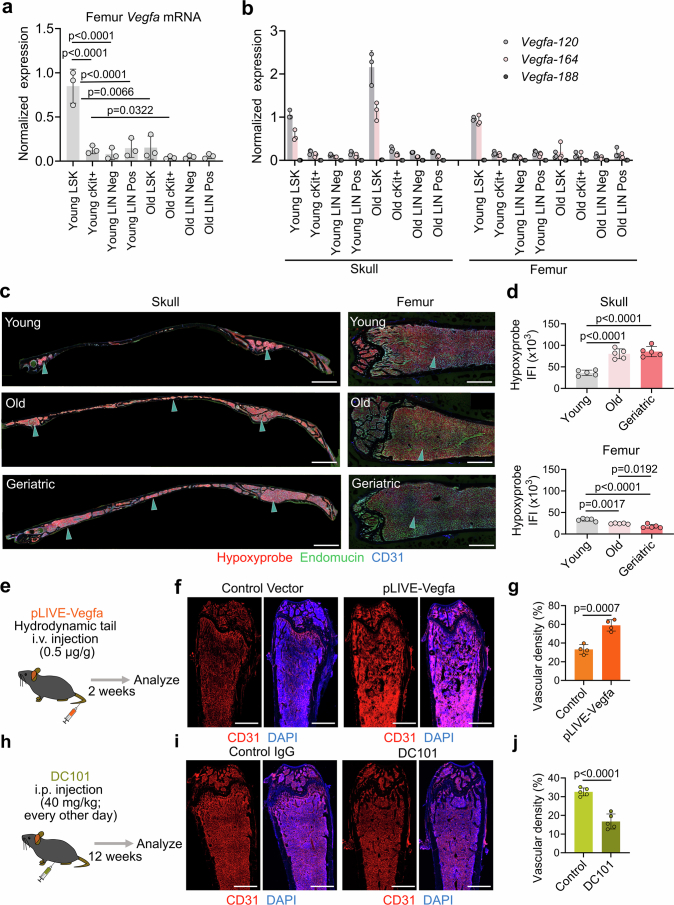
Extended Data Fig. 9. VEGF expression and hypoxia in BM compartments.
a. qRT-PCR analyses of Vegfa mRNA in FACS-sorted LSK (LIN- Sca1+ cKit+), cKit+ (LIN- Sca1- cKit+), Lin neg (LIN- Sca1- cKit-) and Lin pos (LIN+) populations isolated from femur BM of young or old mice (n = 5 mice pooled/sample from three independent experiments). b. qRT-PCR analyses of Vegfa mRNA isoforms in populations shown in (a) isolated from skull or femur BM of young or old mice (n = 5 mice pooled/sample from three independent experiments). c, d. IF staining (c) and quantification (d) of IV-injected Hypoxyprobe in young, old and geriatric skull and femoral BM, as indicated. Note increase of Hypoxyprobe signal in skull but not in femur (arrowheads, n = 5 mice/group from two independent experiments). Scale bars, 1 mm. Vertical bars indicate mean ± SD. **P < 0.01, ***P < 0.001 versus Young LSK (a) or Young (d), #P < 0.05 versus Old by Tukey multiple comparison test (one-way ANOVA). e, h. Diagram showing experimental scheme for Vegfa overexpression or anti-VEGFR2 blocking antibody DC101 treatment. f-j. In vivo IF staining (f, i) and quantification (g, j) of femoral BM blood vessels in mice after hydrodynamic injection of bone-homing Vegfa construct (n = 4 mice/group from three independent experiments) (f, g) or treatment with anti-VEGFR2 blocking antibody (DC101) for 12 weeks (n = 5 mice/group from two independent experiments) (i, j). Scale bars, 1 mm. Vertical bars indicate mean ± SD. P values were calculated using two-tailed unpaired Student’s t-test.

