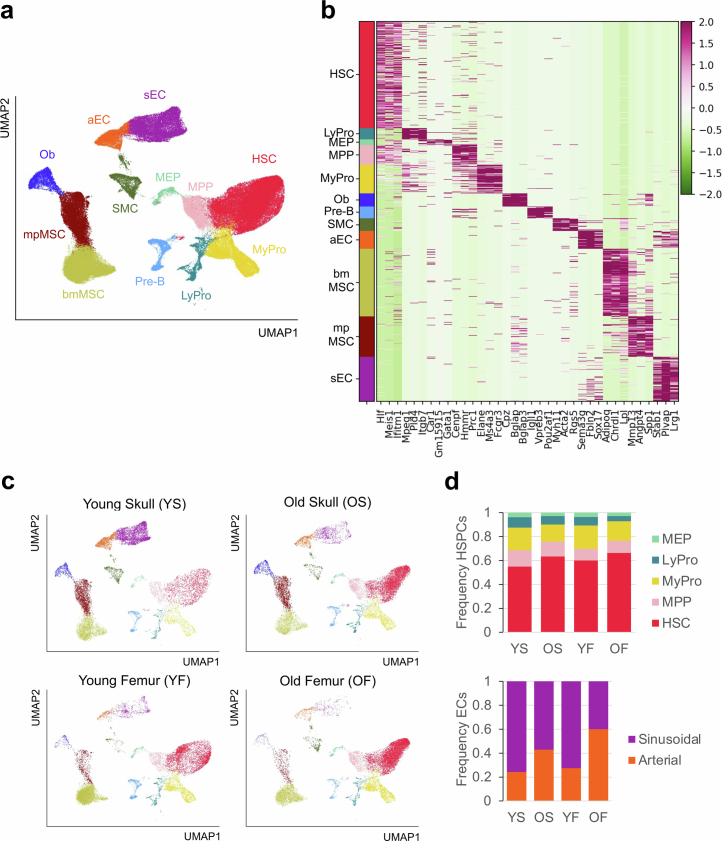
Extended Data Fig. 11. Single-cell RNA-sequencing analysis of HSPCs and stromal cells in skull and femur bone marrow during aging.
a. UMAP plot showing color-coded merged cell clusters of FACS-sorted cKit+ HSPCs and hematopoietic lineage-depleted bone marrow cells. Hematopoietic stem cell (HSC), multi-potent progenitor (MPP), myeloid progenitor (MyPro), lymphoid progenitor (LyPro), megakaryocyte-erythrocyte progenitor (MEP), pre-B-cell (Pre-B), sinusoidal endothelial cell (sEC), arterial endothelial cell (aEC), bone marrow mesenchymal stromal cell (bmMSC), metaphyseal mesenchymal stromal cell (mpMSC), smooth muscle cell (SMC), osteoblast (Ob). b. Heat map showing top cell marker genes of each cell population shown in (a). c. Group-selected color-coded cell clusters from young or old, skull or femur as indicated. d. Frequency plots of color-coded HSPCs (top) and endothelial cells (bottom) from young skull (YS), old skull (OS), young femur (YF), old femur (OF).

