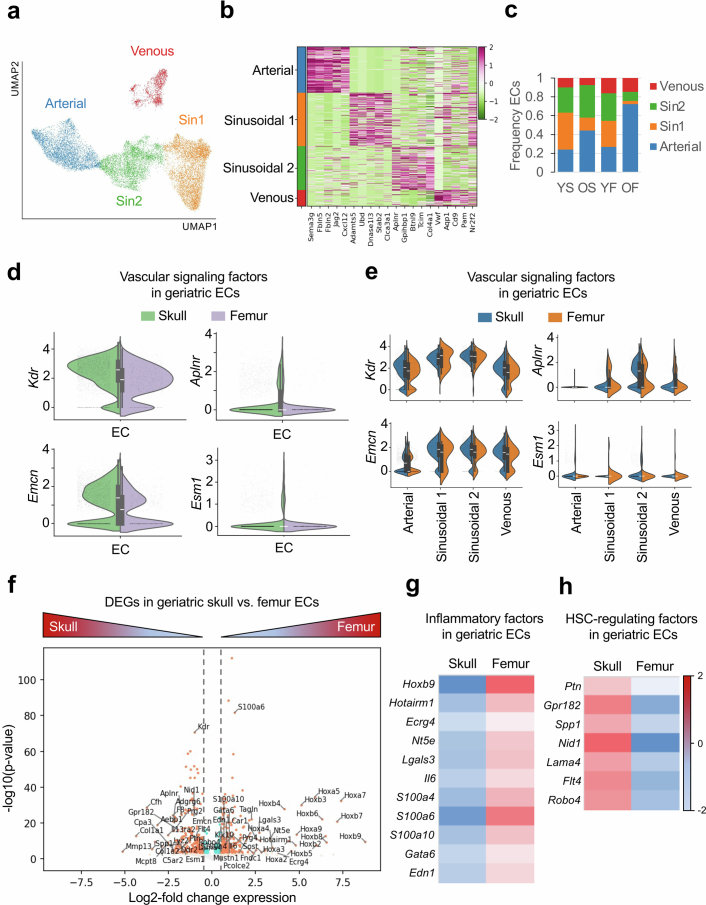
Extended Data Fig. 14. Single-cell RNA-sequencing analysis of ECs in skull and femur bone marrow during aging.
a. UMAP plot showing color-coded merged cell clusters of ECs identified in Extended Data Fig. 11. b. Heat map showing top cell marker genes of each cell population shown in (a). c. Frequency plots of color-coded ECs from young skull (YS), old skull (OS), young femur (YF), old femur (OF). d, e. Violin plots showing the expression of selected genes with log normalized values for vascular signaling factors in ECs (d) and each EC subcluster (e) from geriatric skull versus femur. Skull ECs (n = 2414 cells), Arterial (n = 1070 cells), Sinusoidal 1 (n = 329 cells), Sinusoidal 2 (n = 833 cells), Venous (n = 182 cells) and Femur ECs (n = 594 cells), Arterial (n = 430 cells), Sinusoidal 1 (n = 19 cells), Sinusoidal 2 (n = 58 cells), Venous (n = 87 cells) isolated from n = 5 mice from two independent experiments. The box of each boxplot starts in the first quartile and ends in the third, with the line inside representing the median. f. Differentially expressed genes (DEG) analysis comparing ECs from geriatric skull versus femur. g, h. Heat map showing the expression of selected genes with log normalized values for inflammatory factors (g) and HSC-regulating factors (h) identified in (f). Blue dots, p-adjusted value < 0.01 and Log2 fold change <0.5; orange dots, p-adjusted value < 0.01 and Log2 fold change > 0.5 by two-tailed unpaired Student’s t-test.

