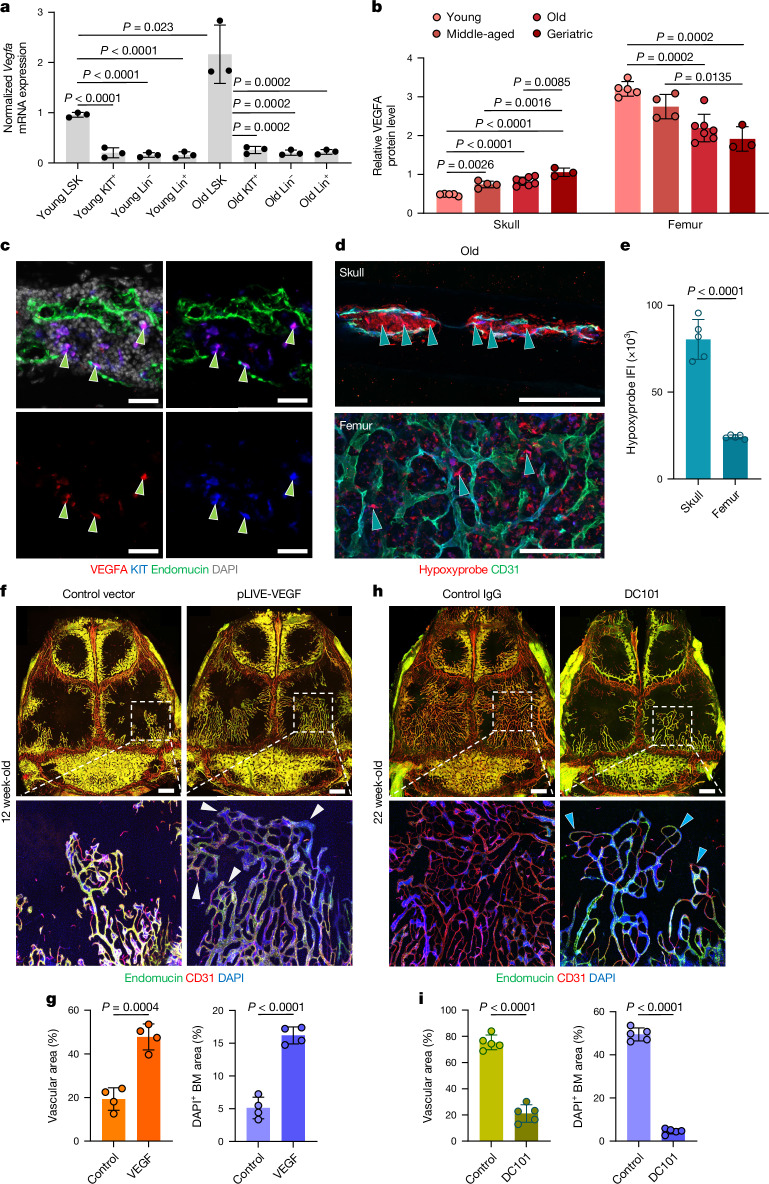
Fig. 4. Role of VEGF in calvarial vascular growth.
a, RT–qPCR analyses of Vegfa mRNA expression in FACS-sorted LSK (Lin−Sca1+KIT+), KIT+ (Lin−Sca1−KIT+), lineage-negative (Lin−Sca1−KIT−) and lineage-positive (Lin+) populations isolated from young or old skull BM. n = 5 pooled mice per sample from 3 independent experiments. b, VEGFA protein concentrations in total BM lysates from skull or femur isolated at various stages of adulthood and ageing. n = 5 young, n = 4 middle-aged, n = 7 old and n = 3 geriatric mice per group from 3 independent experiments. c, Immunofluorescence of skull BM sections showing high anti-VEGFA signal in KIT+ HSPCs (arrowheads). Representative images from three independent experiments. Scale bars, 20 μm. d,e, Immunofluorescence (d) and quantification (e) of intravenously injected Hypoxyprobe in old skull or femoral BM. n = 5 mice per group from 2 independent experiments. Arrowheads indicate labelled cells. Scale bars, 200 μm. IFI, integrated fluorescence intensity. f,g, In vivo immunofluorescence (f) and quantification (g) of calvarial blood vessels in mice expressing bone-homing VEGFA. Note the substantial increase in BM and expansion of vessels (arrowheads) and vascular area. n = 4 mice per group from 3 independent experiments. Scale bars, 1 mm. h,i, In vivo immunofluorescence (h) and quantification (i) of calvarial blood vessels in mice treated with VEGFR2 blocking antibody (DC101) for 12 weeks, showing profound inhibition of BM expansion, suppressed vessel growth (arrowheads) and with decrease in vascular diameter. n = 5 mice per group from 2 independent experiments. Scale bars, 1 mm. Data are mean ± s.d. P values by Tukey multiple comparison test (one-way ANOVA) and two-tailed unpaired Student’s t-test.

