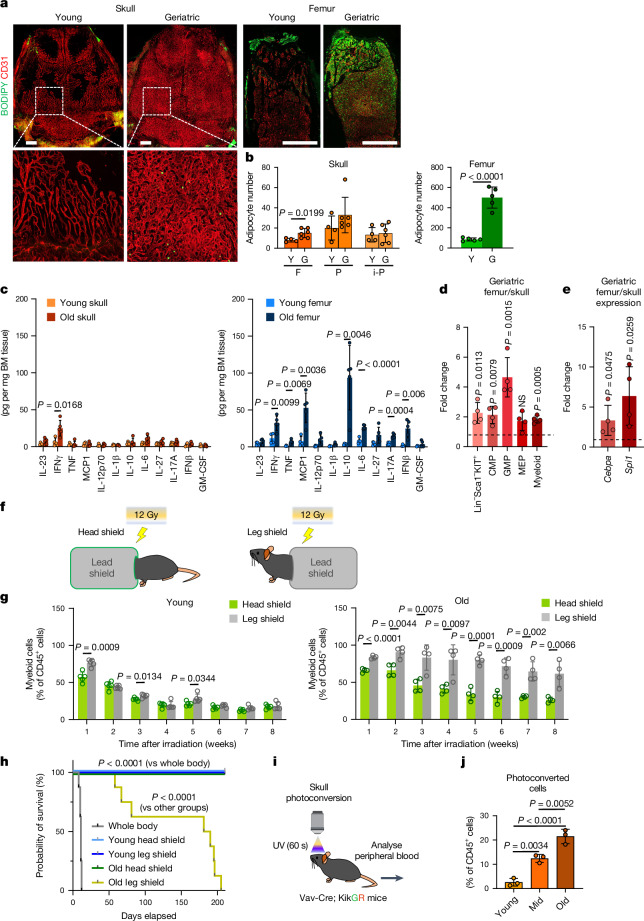
Fig. 5. Properties and function of ageing skull marrow.
a,b, Staining (a) and quantification (b) of adipocytes (BODIPY) and blood vessels (CD31) in skull or femoral BM of young or geriatric mice. Scale bars, 1 mm. n = 4 (young skull), n = 6 (old skull), n = 5 (all other groups) mice per group from 4 independent experiments. F, frontal; P, parietal; i-P, interparietal. c, Quantification of inflammatory cytokines by multiplex array analysis of total BM lysates from young or old skull or femur. n = 4 (young skull), n = 5 (old skull), n = 4 (young femur), n = 5 (old femur) mice per group from 2 independent experiments. d,e, Quantification of myeloid progenitors and progeny by FACS (d; difference in percentage of live cells) and RT–qPCR analyses of myeloid determination factors (e) of geriatric skull versus femur BM. Lin−Sca1−KIT+, common myeloid progenitor (CMP), granulocyte-monocyte progenitor (GMP), megakaryocyte-erythrocyte progenitor (MEP). Each value is the fold change difference between geriatric femur sample and corresponding skull sample from the same mouse. n = 4 mice per group from 2 independent experiments. f,g, Scheme of shielding experiments (f) and FACS analysis of CD11b+ myeloid cells in peripheral blood (g) isolated from mice with head versus leg shielding. n = 5 (young) and n = 4 (old) mice per group from 3 independent experiments. h, Kaplan–Meier survival plot showing survival of mice after whole-body irradiation or shielding skull or hindlimbs. n = 8 mice per group from 2 independent experiments. i, Schematic showing skull BM photoconversion in Vav-cre;Rosa26-KikGR mice. j, FACS analysis of photoconverted CD45+ haematopoietic cells in peripheral blood. n = 3 mice per group from 3 independent experiments. Data are mean ± s.d. P values by two-tailed unpaired Student’s t-test, log-rank test and Tukey multiple comparison test (one-way ANOVA).

