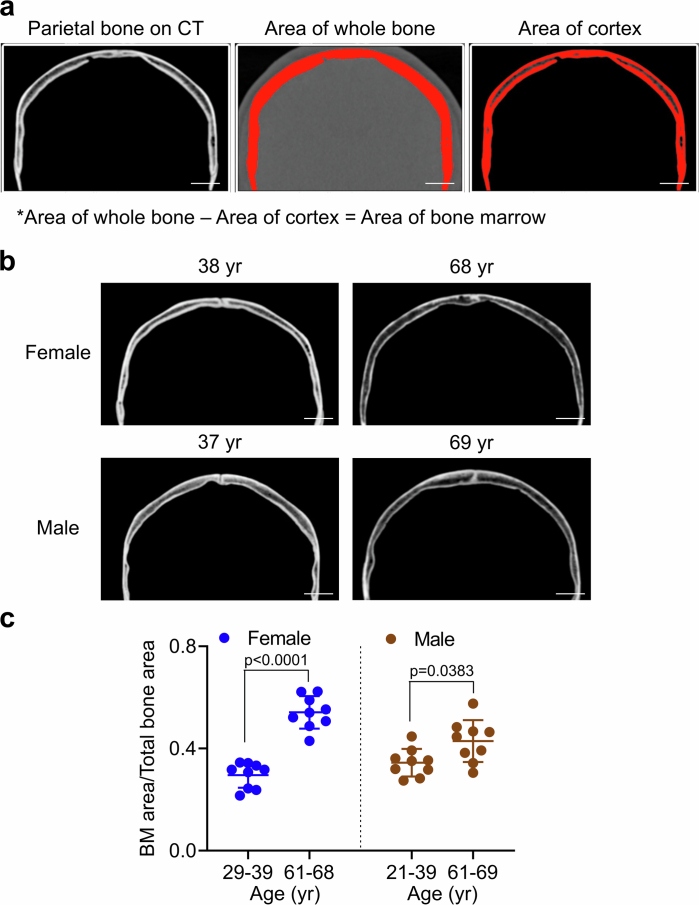
Extended Data Fig. 2. Age-related expansion of diploic space in human skull.
a. Method for quantification of whole bone, cortex and bone marrow areas in human patient CT scans. b, c. Representative coronal CT images (b) and quantification (c) of young (21–40 years old) and old (61–69 years old) female and male human skulls showing enlargement of diploic space with aging (n = 9 patients/group). Scale bars, 2 cm. Vertical bars indicate mean ± SD. P values were calculated using two-tailed unpaired Student’s t-test.

