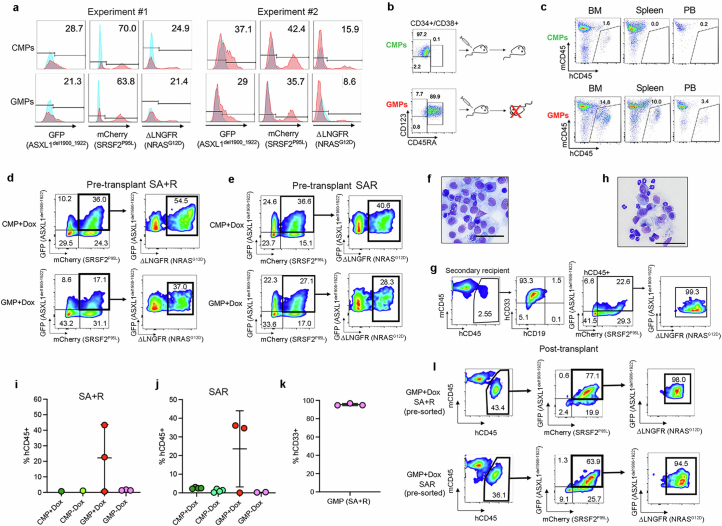
Extended Data Fig. 5. Leukemogenesis from CB GMPs.
a, Transduction efficiency of SA + R CB CMPs and GMPs from two independent experiments. b, Sorted SA + R CB CMPs and GMPs were injected into NSGS mice. A mouse that received SA + R GMPs succumbed to a lethal disease 11 weeks after transplantation, while a mouse transplanted with SA + R CMPs showed no signs of illness. c, Engraftment in mice transplanted with SA + R CMPs or GMPs 11 weeks after transplantation. d,e, Sorted CMPs (upper panels) and GMPs (lower panels) from the experiments depicted in Fig. 2g (d) and Fig. 2h (e), cultured with Dox and assayed on the day of transplantation (day 8). f, Wright-Giemsa-stained human cells with blast morphology retrieved from the BM of a mouse transplanted with SA + R GMPs. Image representative of 3 independent experiments. Scale bar, 50 μm. g, BM engraftment in a secondary recipient mouse upon serial transplantation of SA + R GMPs from the experiment shown in Fig. 2g. h, Wright-Giemsa-stained cells from the BM of a secondary recipient mouse transplanted with SA + R GMPs. The larger cells are human blasts. The smaller cells with segmented nuclei correspond to murine neutrophils. Scale bar, 50 μm. i,j, Engraftment in the BM of mice transplanted with SA + R from Fig. 2g (i) or SAR from Fig. 2h (j) CMPs or GMPs at the endpoint of the experiment. n = 1 mouse for each SA + R CMP group; 3 mice for each SA + R GMP group; 4 mice for each SAR CMP group; 3 for GMP+Dox and 2 for GMP-Dox. Mean and SD are shown. k, Percentage of CD33+ myeloid cells (of hCD45+ cells) in the BM of mice (n = 3) transplanted with SA + R GMPs from Fig. 2g. Mean and SD are shown. l, Flow cytometry analysis of a representative mouse transplanted with sorted SA + R or SAR GMPs from the experiments schematically depicted in Fig. 2g,h, respectively, showing that the leukemic cells co-express all 3 mutant transgenes.

