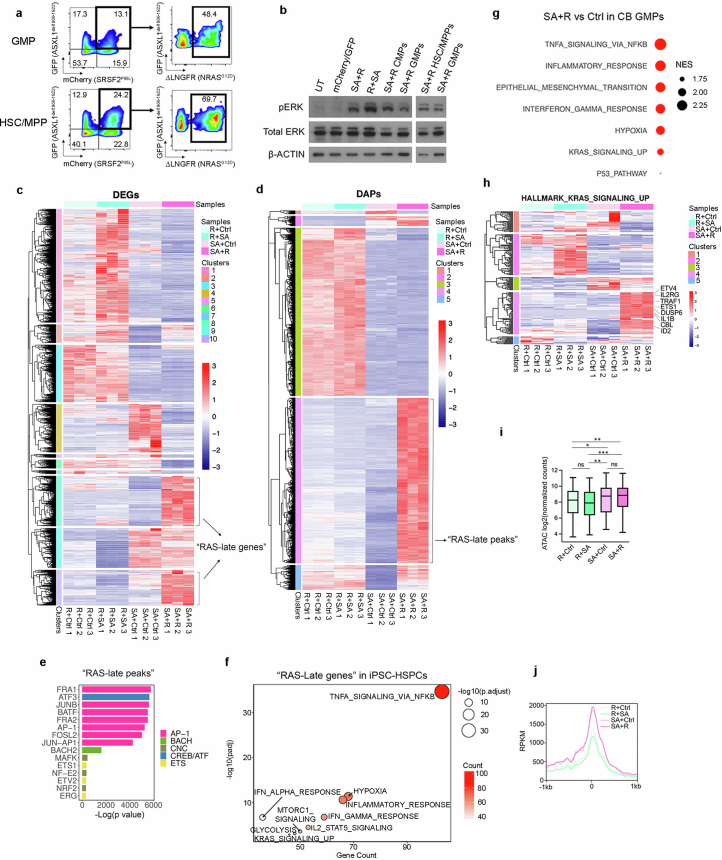
Extended Data Fig. 6. Genomics analyses of genetically engineered iPS- and CB- HSPCs.
a, Transgene expression in sorted GMPs and HSC/MPPs transduced with SA + R. b, Assessment of ERK activation (phospho-ERK, pERK) by Western blotting in total CB CD34+ cells or FACS-sorted CMPs, GMPs and HSC/MPPs transduced with the indicated lentiviral vectors or untransduced (UT). Shown is one representative experiment out of 2. Samples were derived from the same experiment and processed in parallel. β-actin controls were run on different gels as sample processing controls. For source data, see Supplementary Fig. 4. c, Hierarchical clustering of expression values of differentially expressed genes (DEGs) from the SA + R vs SA+Ctrl and SA + R vs R + SA comparisons. Genes belonging to clusters 8 and 10 were designated as “RAS-late genes”. d, Hierarchical clustering of accessibility scores of differentially accessible peaks (DAPs) from the SA + R vs SA+Ctrl and SA + R vs R + SA comparisons. The peaks of cluster 4 were designated as “RAS-late peaks”. e, Top statistically significant transcription factor (TF) motifs (identified using the Homer motif discovery package) enriched in the “RAS-late” peaks from d, grouped by TF families. f, Selected top enriched (over-representation analysis) HALLMARK pathways in the “RAS-late genes” from c. Count: number of “RAS-late genes” in the gene set. Adjusted p values were derived from GSEA. g, Selected enriched (FDR < 0.1) HALLMARK pathways in SA + R vs Ctrl cells of the GMP cluster from Fig. 2b. NES: normalized enrichment score. h, Expression of the genes belonging to the “KRAS signaling up” HALLMARK gene set. Cluster 4 contains 65 genes that are upregulated specifically in the SA + R group. i, Aggregate accessibility of the 65 genes related to RAS signaling that are specifically upregulated in SA + R iPS-HSPCs (cluster 4 genes from h). *P < 0.05, **P < 0.01, ***P < 0.001, ns: not significant (two-tailed unpaired t-test). The top and bottom lines of the whiskers denote the highest and lowest values, respectively. The box spans the interquartile range (25th-75th percentile) and the line represents the median. j, Accessibility (Reads Per Kilobase per Million mapped ATAC reads, RPKM) within 1 kb on either side of the transcription start site (TTS) of the 65 genes related to RAS signaling that are specifically upregulated in SA + R iPS-HSPCs (cluster 4 genes from h), showing higher accessibility in SA + R and SA+Ctrl cells, compared to the R + SA and R+Ctrl groups. The X axis shows distance from the TTS. One representative replicate per condition is shown.

