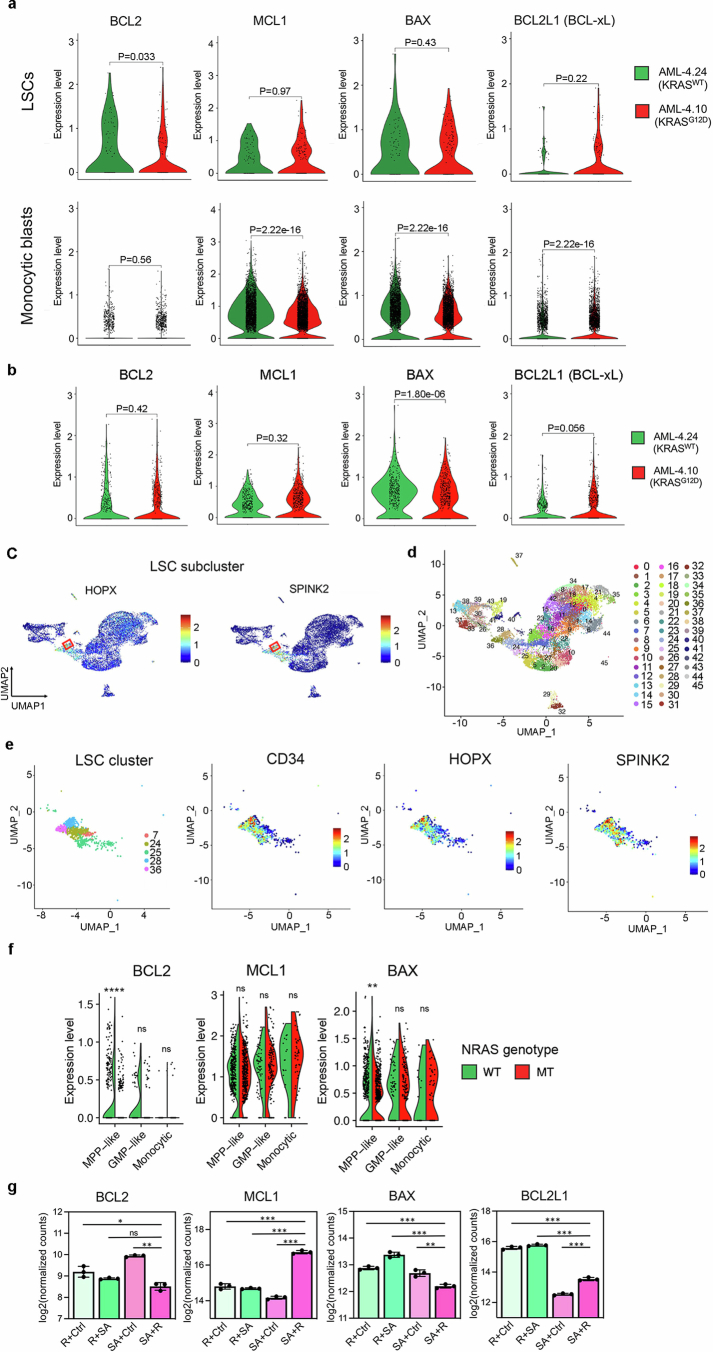
Extended Data Fig. 9. Single-cell transcriptomic analyses of AML-iPS cell-LSCs.
a, Violin plots showing expression of anti- and pro-apoptotic genes of the BCL2 family in monocytic blasts (monocytic metacluster generated by merging all monocytic and dendritic cell clusters shown in Fig. 3b and Extended Data Fig. 7a) or LSCs (cluster 28 shown in b-d) within the AML-4.10 and AML-4.24 leukemia cells from xenografts. P values were calculated with a two-sided Wilcoxon test. b, Expression of anti- and pro-apoptotic genes in the LSC cluster shown in Fig. 3b without subclustering in the iPS cell-derived leukemia cells from xenografts. P values were calculated with a two-sided Wilcoxon test. c, Expression of HSC markers SPINK2 and HOPX projected onto the integrated UMAP. The red squares indicate the LSC subcluster (cluster 28 shown in c,d). d, UMAP representation of single-cell transcriptome data in resolution 3.2, yielding 46 clusters. e, Left panel: UMAP representation of the LSC cluster (from resolution 0.4 clustering shown in Fig. 3b) subdivided into 5 clusters (from resolution 3.2 clustering shown in c). Middle and right panels: Expression of HSC markers CD34, HOPX and SPINK2 projected onto the LSC cluster UMAP. f, Split-violin plots showing expression of anti- and pro-apoptotic genes in monocytic blasts or immature MPP-like and GMP-like cells of the NRASMT and NRASWT genetic clones from GoT data. **P < 0.01, ****P < 0.0001, ns: not significant (two-tailed Wilcoxon test). g, Normalized expression of the indicated pro- and anti- apoptotic genes in the genetically engineered iPS-HSPCs shown in Fig. 2d (n = 3 independent experiments for all groups). *P < 0.05, **P < 0.01, ***P < 0.001, ns: not significant (two-tailed unpaired t-test).

