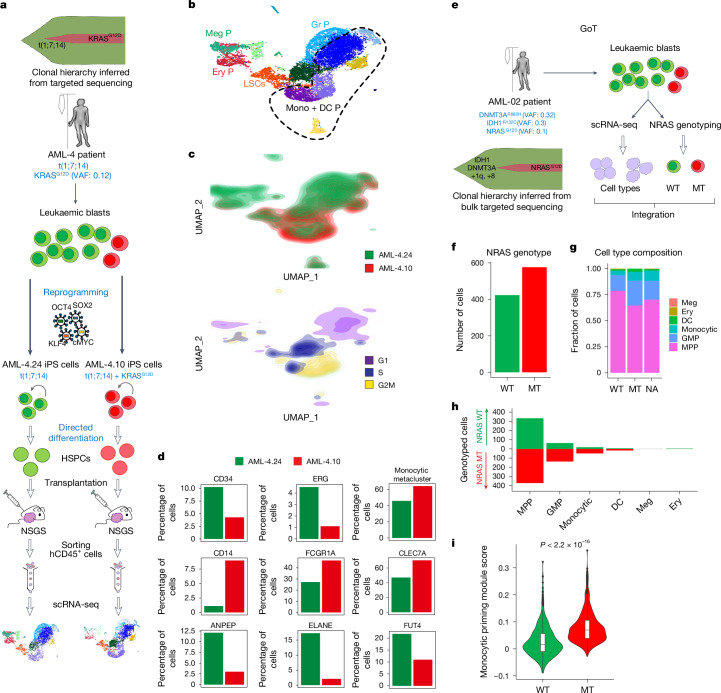
Fig. 3. RAS-MT AML LSCs produce leukaemic cells with monocytic features.
a, Two iPS cell lines derived from a patient with AML with a clonal t(1;7;14) translocation and a subclonal KRASG12D mutation, one capturing the RASWT major clone (AML-4.24) and one the KRASG12D subclone (AML-4.10) of the patient AML were differentiated to HSPCs, transplanted into NSGS mice, allowed to generate lethal leukaemias, collected, sorted and subjected to scRNA-seq analysis. b, UMAP representation of single-cell transcriptome data. The dashed line delineates the monocytic metacluster. c, Cell density across the UMAP coordinates from b. Cells coloured by sample (top panel) or phase of the cell cycle (bottom panel). d, Percentage of cells expressing the indicated genes (normalized counts > 0.5) or contained in the monocytic metacluster (shown in b). e, Schematic of the GoT experiment. f, Number of cells that could be genotyped as NRAS-WT (423 cells) or MT (576 cells) by GoT. g,h, Fraction (g) and absolute number (h) of cells belonging to each cell type assigned from transcriptome data in the NRAS-WT and NRAS-MT cells (NA, not assigned to a NRAS genotype). Cells belonging to the NRAS-MT clone contain a higher fraction of monocytic cells (Fisher’s exact test P value = 0.00028, odds ratio = 3.255) and lower fraction of immature HSC/MPP-like cells (Fisher’s exact test P value = 3.044 × 10⁻¹¹, odds ratio = 0.3345) than NRAS-WT cells. i, Expression of a monocytic priming gene module (IRF7/IRF8) from ref. 32 in NRAS-WT and MT cells. The whiskers denote the 1.5× interquartile range (IQR). The lower and upper hinges of the boxes represent the first and third quartiles, respectively. The middle line represents the median. Points represent values outside the 1.5× IQR. The P value was calculated with a two-sided Wilcoxon test.

