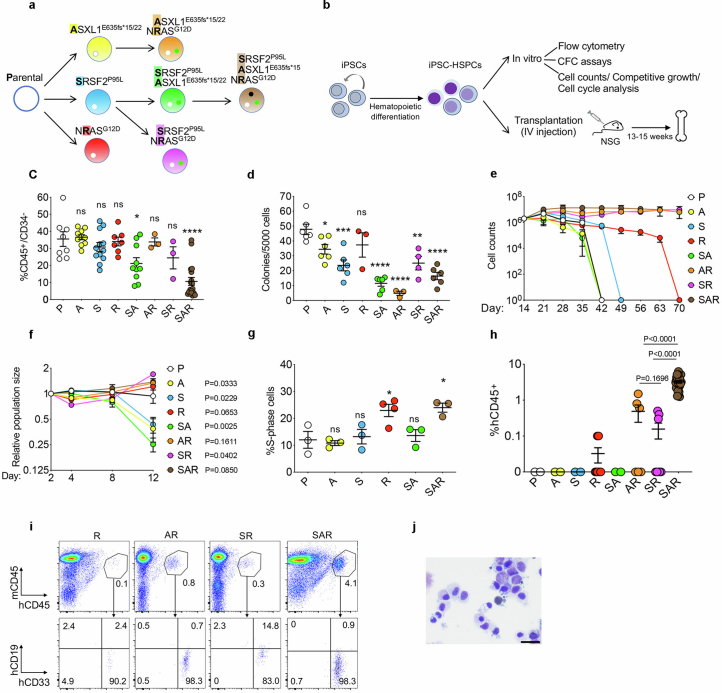
Extended Data Fig. 1. Characterization of in vitro and in vivo leukemic properties of edited iPS-HSPCs with single, double and triple mutations.
a, Isogenic single, double and triple-mutant iPS cell lines generated through sequential CRISPRCas9-mediated gene editing of a normal iPS cell line (Parental). b, Overview of in vitro and in vivo phenotypic assessment of iPS-HSPCs. c, Fraction of CD34−/CD45+ cells, i.e. hematopoietic cells that have lost CD34 expression upon maturation, on day 14 of hematopoietic differentiation. Mean and SEM from n = 8(P), 10(A, SA), 12(S), 7(R), 3(AR, SR), and 19(SAR) independent differentiation experiments with 2 (A, S, SA, AR, SR, SAR) or 3(R) iPS cell lines per genotype are shown. *P < 0.05, ****P < 0.001, ns: not significant (two-tailed unpaired t test). d, Number of methylcellulose colonies obtained from iPS-HSPCs on day 14 of hematopoietic differentiation. Mean and SEM from n = 6(P, A, S, SA, SAR), 3 (R, AR) and 4(SR) independent differentiation experiments with 2 iPS cell lines per genotype are shown. *P < 0.05, **P < 0.01, ***P < 0.001, ****P < 0.0001, ns: not significant (two-tailed unpaired t test). e, Cell counts of iPS-HSPCs in liquid hematopoietic differentiation culture. Mean and SEM of n = 2(P, R, AR, SR), 4(A, SAR), 6(S) and 11(SA) independent differentiation experiments with 1 (P, R, SAR) or 2 (A, S, AR, SR, SA) iPS cell lines per genotype are shown. f, Competitive growth assay. The cells were mixed 1:1 at the onset of hematopoietic differentiation with an isogenic normal iPS cell line stably expressing GFP. The relative population size was estimated as the percentage of GFP- cells (calculated by flow cytometry) at each time point relative to the population size on day 2. Mean and SEM from n = 3(P), 4(A), 6(S, R), 5(SA), 2(AR,SR) and 8(SAR) independent differentiation experiments with 2 (P, A, R, SA, AR, SR, SAR) or 3 (S) iPS cell lines per genotype are shown. P values were calculated with a two-tailed unpaired t test. g, Cell cycle analyses of iPS-HSPCs. Mean and SEM from 3 (P, A, S, SA, SAR) and 4 (R) independent differentiation experiments with one line per genotype are shown. *P < 0.05 (R vs P: P = 0.0336; SAR vs P: P = 0.0279), ns: not significant (two-tailed unpaired t test). h, Human engraftment in the BM of NSG mice 13-15 weeks after transplantation with HSPCs derived from the indicated gene-edited mutant iPS cell lines (1 or 2 lines per genotype). Error bars show mean and SEM of values from individual mice. n = 2 (P); 2(A); 2(S); 8(R); 2(SA); 6(AR); 8(SR); 27(SAR). P values were calculated with a two-tailed unpaired t test. i, Representative flow cytometry for evaluation of human engraftment in mouse BM. j, Wright-Giemsa-stained BM cells retrieved from a mouse transplanted with SAR iPS-HSPCs. Scale bar, 25 μm. P: Parental; A: ASXL1-mutant; S: SRSF2-mutant; R: NRAS-mutant; SA: SRSF2-ASXL1 double mutant; AR: ASXL1-NRAS- double mutant; SR: SRSF2-NRAS double mutant; SAR: SRSF2-ASXL1-NRAS triple mutant.

