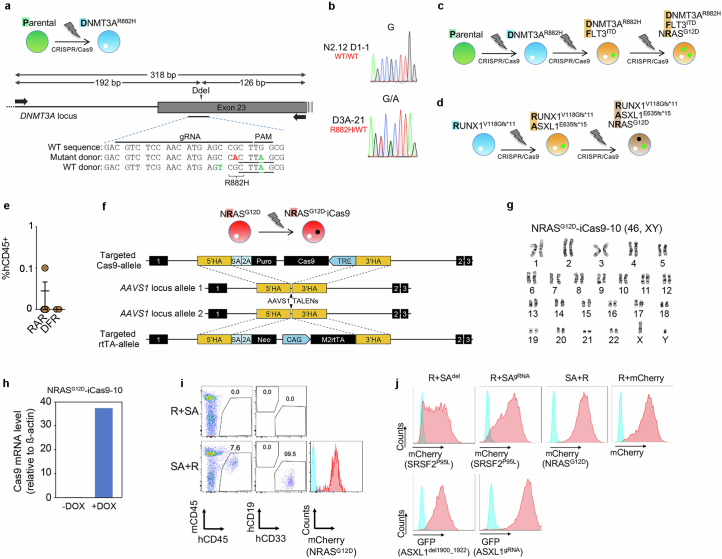
Extended Data Fig. 2. Generation and characterization of additional edited iPS cell lines.
a, Gene editing strategy to generate a heterozygous DNMT3AR882H mutation in the same normal parental iPS cell line used to generate the lines shown in Extended Data Fig. 1, through homology-directed repair with simultaneous delivery of one mutant and one WT donor templates. Schematic representation of the DNMT3A locus with the position of the gRNA target sequence and the PCR primers used for RFLP analysis shown. Silent mutations introduced in the donor to create the DdeI restriction site (underlined) and inactivate the PAM motif are indicated in green font. The G→A mutation giving rise to the R882H amino acid substitution is shown in red font. b, Sanger sequencing confirming the G→A heterozygous point mutation giving rise to the R882H amino acid substitution in one edited DNMT3AR882H iPS cell line selected after screening. c,d, Schematic of gene editing steps to generate the iPS cell lines with single, double and triple driver mutations starting from the parental WT (c) or an iPS cell line derived from a RUNX1- familial platelet disorder (FPD) patient harboring a germline RUNX1V118Gfs*11 mutation (d). e, Human engraftment in the BM of NSG mice 13-15 weeks after transplantation with gene-edited iPS-HSPCs. Mean and SEM is shown. RAR: RUNX1-ASXL1-NRAS triple mutant (n = 5 mice); DFR: DNMT3A-FLT3-NRAS triple mutant (n = 2 mice). f, Gene targeting strategy used to introduce a tetracycline response element (TRE)-driven Cas9 and the reverse tetracycline transactivator (rtTA), respectively, into the two alleles of the AAVS1 locus using TALEN-mediating targeting. g, Karyotype of iPS cell line NRASG12D-iCas9-10 confirming a normal diploid karyotype. h, Confirmation of induction of iCas9 expression by DOX in the NRASG12D-iCas9-10 iPS cells by qRT-PCR. i, Representative flow cytometric evaluation of engraftment in mice transplanted with the iPS-HSPCs shown in Fig. 1a,b. j, Representative flow cytometric evaluation of transduction efficiency of iPS-HSPCs with the lentiviral constructs shown in Fig. 1a, co-expressing the indicated fluorescent protein genes.

