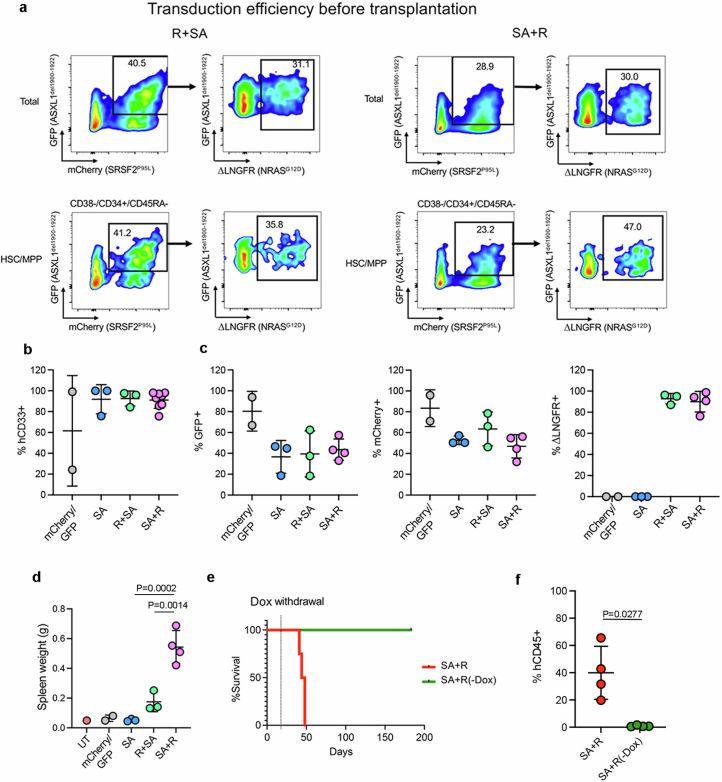
Extended Data Fig. 3. Leukemogenesis in CB CD34+ cells.
a, Transduction efficiency of CB CD34 + R + SA and SA + R cells prior to transplantation (day 8 depicted in Fig. 1c). b, Percentage of CD33+ myeloid cells (of hCD45+ cells) in the BM of mice transplanted with CB CD34+ cells shown in Fig. 1c. Mean and SD of values from individual mice is shown. n = 2 (mCherry/GFP), 3 (SA), 3 (R + SA) and 8 (SA + R) mice. c, Percentage of hCD45+ cells from transplanted mice expressing each lentiviral transgene (based on expression of the linked fluorescent protein). Mean and SD of values from individual mice is shown. n = 2 (mCherry/GFP), 3 (SA), 3 (R + SA) and 4 (SA + R) mice. d, Spleen weight of transplanted mice. n = 2 (mCherry/GFP), 3 (SA), 3 (R + SA) and 4 (SA + R) mice. UT: untransplanted. Mean and SD are shown. P values were calculated with one way ANOVA. e,f, Survival (e) and BM engraftment (f) of mice injected with SA + R CB CD34+ cells under continuous Dox administration or following Dox withdrawal 14 days after transplantation. Mean and SD of values from 4 individual mice per group are shown. P value was calculated with a two-tailed unpaired t test.

