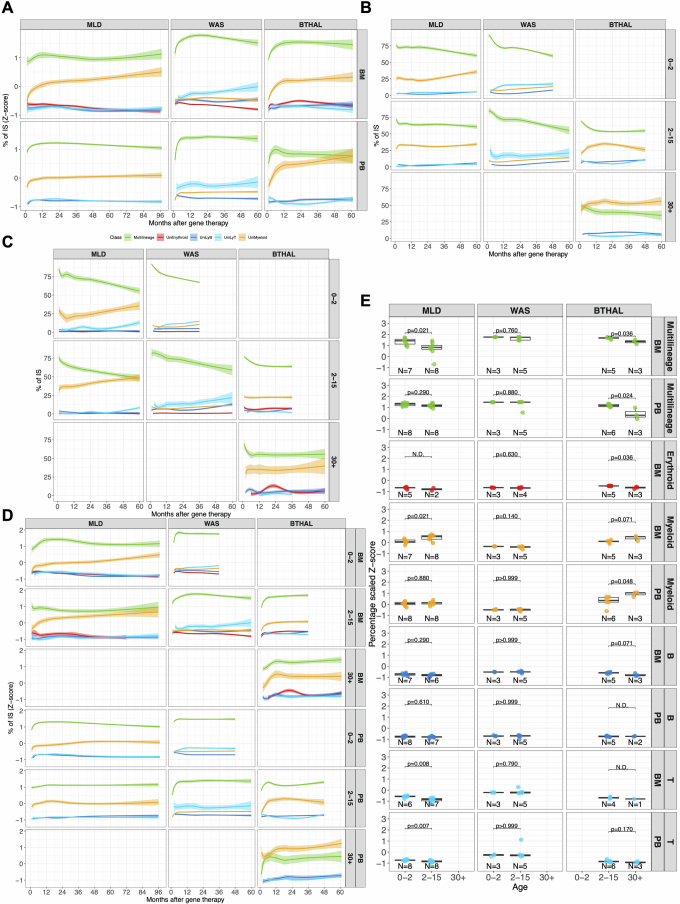
Extended Data Fig. 6. HSC lineage commitment.
(A) Z-score normalization of the HSC lineage commitment over time expressed as percentage on the recaptured clones. The plot represents the scaled relative percentage of the shared IS (y-axis) over time (x-axis) for recurrent clones (IS observed in at least two time points for each patient) on the overall number of cells observed in multilineage (green line) or mature uni-lineages (erythroid in red, myeloid in yellow, B in blue, T in light blue). Lines are spline regression curves using a log curve with 0.75 CI. (B) HSC lineage commitment as the percentage of shared ISs of recurrent clones (y-axis) over time (x-axis) for PB samples stratified by clinical trials (in columns) and patient’s age (in rows the three classes of age: 0–2 years, 2–15 years, and >30 years). Colors are associated with multilineage clones (green line) or mature uni-lineages (erythroid in red, myeloid in yellow, B in blue, T in light blue). (C) HSC lineage commitment in BM, similar to (B). (D) Similar to (A), Z-score normalization of the HSC lineage commitment over time expressed as percentage on the recaptured clones and stratified by age. (E) Boxplot representation of the HSC lineage commitment normalized (Z-score) and averaged to compare the different clinical studies (in columns) for multi-lineage or mature committed lineages and tissues (rows); patients are grouped by their age of treatment (groups “0–2” years, “2–15” years, and “>30” years). Statistical results are expressed with lines between pairs of age groups (Kruskal Wallis test). The bars represent the median, the whiskers extend to 1.5 times the IQR, and the p-value threshold is set at 0.05.

