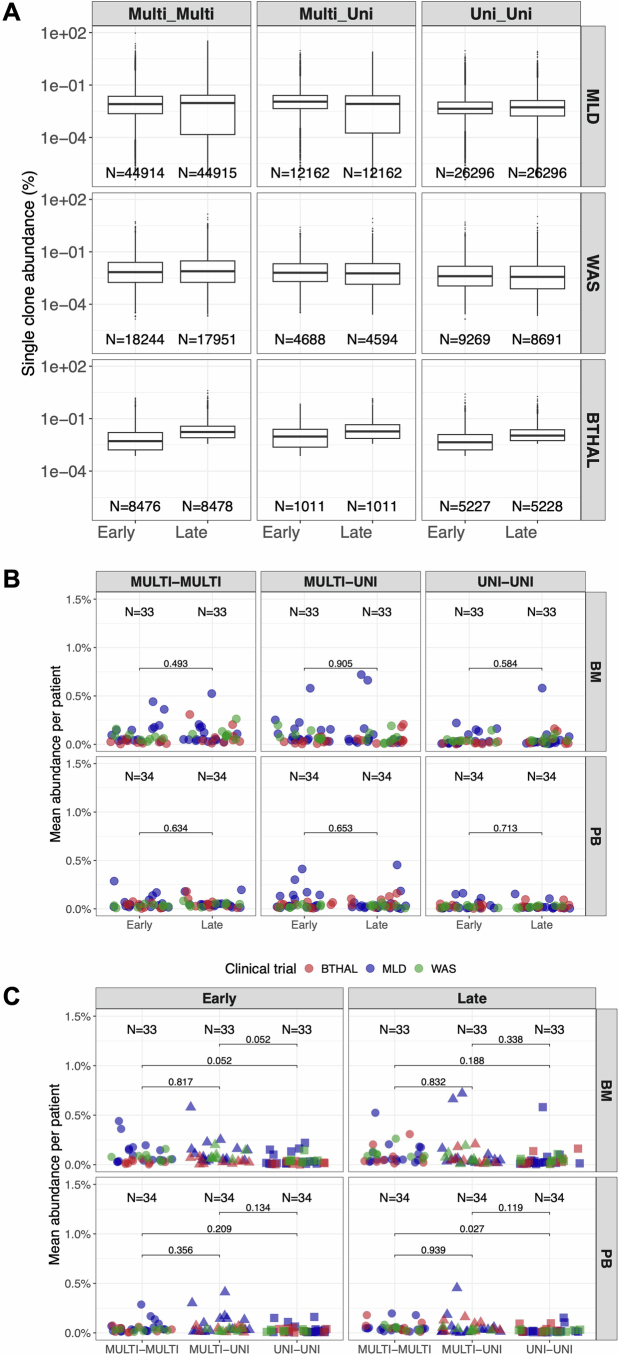
Extended Data Fig. 8. Transitioning clones in HSPC commitment.
(A) Boxplot representation of single IS clonal abundances per class (multi-lineage or specific uni-linage) in early time points (<24 months) or late time points (>24 months). In all boxplots, the bars represent the median, the whiskers extend to 1.5 times the IQR. (B) Lineage commitment per clone comparing clonal abundances over time (early versus late, <24 months and >24 months respectively) in BM and PB across the different classes (multi-lineage or uni-lineage) and transitions (multi-multi, multi-uni, or uni-uni). Statistical results are expressed with lines between pairs of age groups (Kruskal Wallis test). Patients in each clinical program are represented with dots and colored in blue, green, or red if enrolled in MLD, WAS, or β-Thal study. (C) Similar to (A), we compared lineage commitment clonal abundances per class (multi-lineage or uni-linage) within early time points (<24 months) or late time points (>24 months).

