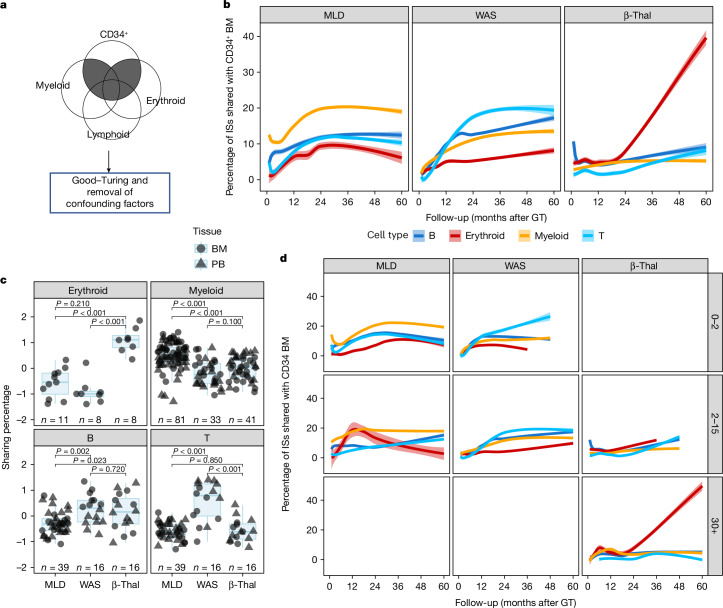
Fig. 2. Lineage output of CD34+ cells.
a, Strategy for the analysis of CD34+ cells and lineage output: for each time point, we computed the proportion of the shared ISs retrieved for each lineage (among myeloid, erythroid, B and T cells) and CD34+ ISs (sharing ratio). b, Dynamics of the sharing ratio (y axis) as lineage output (with different colours) of CD34+ cells over time (x axis) for the three clinical trials. Spline curves with CI 0.75. c, Box plots of sharing ratio (bar indicates median, whisker 25–75 percentiles), normalized by Z-score (y axis) isolated in all patients from 24 months and averaged, in BM and PB tissues (circle or triangular dot shapes), grouping cell markers (colours) by cell lineages. Statistical tests are performed between pairs of clinical studies (Kruskal–Wallis test). The bars represent the median, the whiskers extend to 1.5 times the interquartile range (IQR) and the P value threshold is set at 0.05. d, Similar to b, CD34+ BM lineage output over time stratified by age groups (0–2, 2–15 and older than 30 years old).

