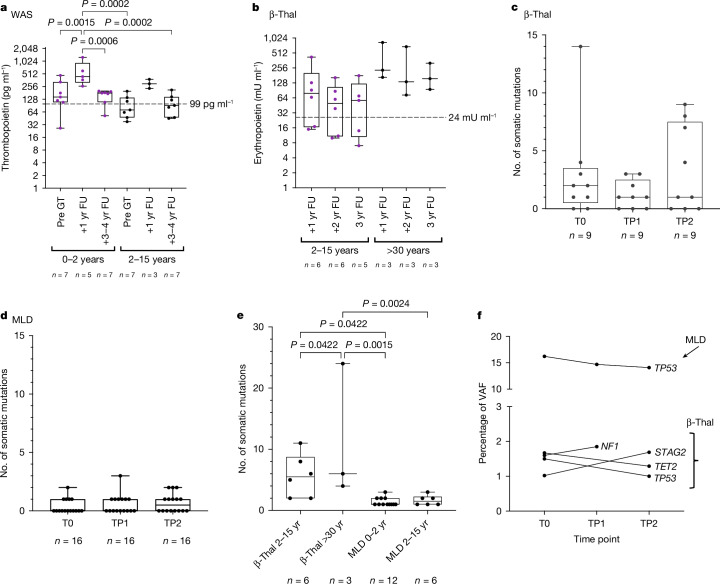
Fig. 4. TPO and EPO concentrations in patients with WAS and β-Thal, and somatic mutations in patients with MLD and β-Thal.
a, TPO concentration s in patients with WAS before GT (Pre-GT), at 1 year follow-up (1 yr FU) and 3–4 years post-GT (3–4 yr FU), stratified by age at treatment: 0–2 years (0–2 yr) and 2–15 years (2–15 yr). b, EPO concentrations in patients with β-Thal at 1 year (1 yr FU), 2 year (2 yr FU) and 3 year (3 yr FU) follow-ups, stratified by age at treatment: 2–15 years (2–15 yr) and more than 30 years (>30 yr). One-way ANOVA. c,d, Somatic mutations in patients with β-Thal (n = 9) (c) and MLD (n = 16) (d) over time (T0, before infusion; TP1, 2 years posttransplant; TP2, max 5–7 years posttransplant). No significant differences by Friedman’s test. e, Comparison of somatic mutation frequencies between patients with β-Thal and MLD by age group. One-way ANOVA. f, Percentage of VAF over time for somatic mutations found in several time points in patients with MLD and β-Thal, with mutated genes and clinical programmes indicated. In all box plots, the central line represents the median and the whiskers indicate the range, showing the minimum and maximum values.

