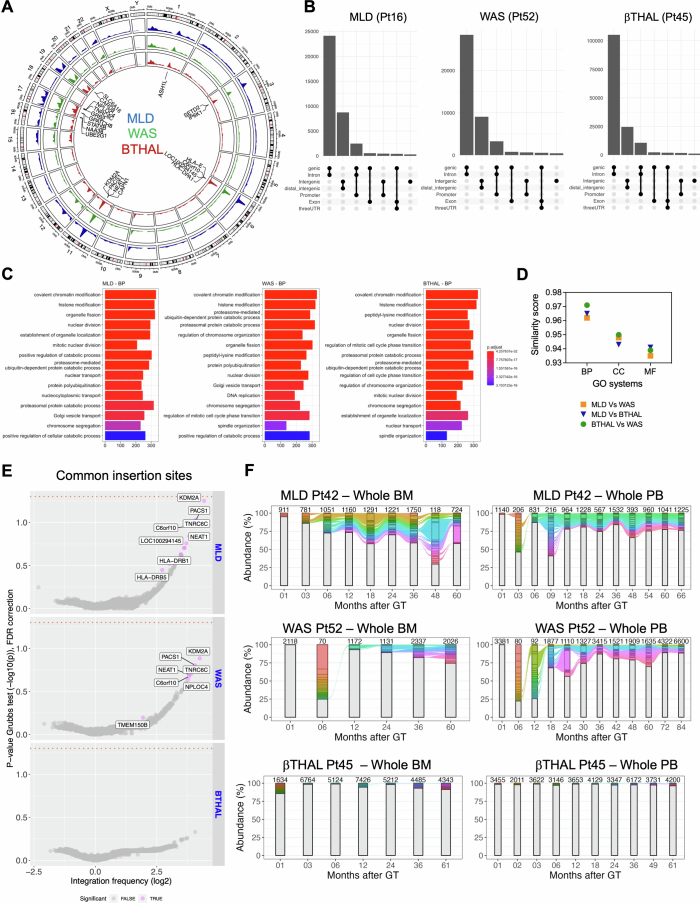
Extended Data Fig. 1. Genome wide distribution of IS.
(A) Circular representation of the genomic distribution of the ISs for the three clinical trials (MLD in the blue track, WAS in the green track, β-Thal in the red track). (B) UpSet plot displaying IS distribution around targeted genes for a sample patient in each trial (Pt16 for MLD, Pt52 for WAS, Pt45 for β-Thal). The rows list gene features, with combinations represented by connecting lines and histograms showing element counts. (C) Gene ontology analysis for the three trials, showing the results for biological processes (BP), first 15 classes. (D) GO similarity plot comparing ontological enrichments among the trials. Pairwise similarity scores (“MLD-WAS,” “MLD-β-Thal,” “WAS-β-Thal”) are presented on the y-axis, covering all GO categories cellular components (CC), biological processes (BP), and molecular functions (MF). (E) CIS results displayed as volcano plots for each trial. Each gene is represented as a dot, with integration frequency on the x-axis (log2 scale) and the associated p-value on the y-axis (−log10). The orange dashed line indicates the alpha value of 0.05. Genes are colored gray if never significant or violet if significant in at least one patient. (F) Stacked bar plot tracking top clones (≥ 1% in MLD/WAS, ≥0.1% in β-Thal) over time for the first patient in each trial (MLD Pt42, WAS Pt52, β-Thal Pt45). Each colored bar represents a clone, with height proportional to abundance. Colored ribbons connect neighboring time points for recaptured clones. BM-derived clones are on the left, PB-derived IS on the right, with the number of observed IS reported above each bar.

