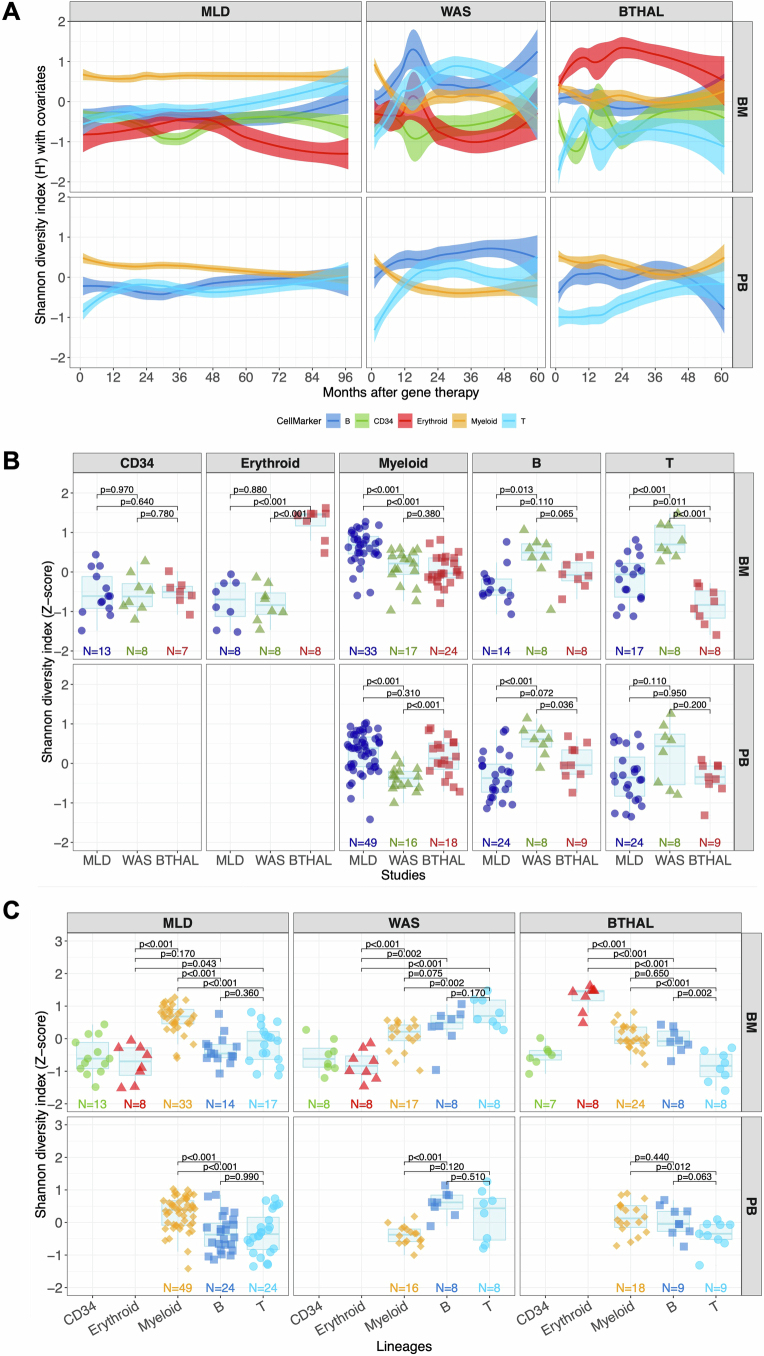
Extended Data Fig. 2. Clonal complexity and diversity.
(A) Population diversity index (Shannon entropy, H) over time, normalized with Z-score by patient and time point, divided by disease condition and tissue. Colors refer to lineages (CD34+ cells, myeloid, erythroid, B and T); spline with CI 0.75. (B) Statistical comparisons of population diversity index among the different diseases grouping values by lineages and tissues (Kruskal–Wallis test). The bars represent the median, the whiskers extend to 1.5 times the IQR, and the p-value threshold is set at 0.05. (C) Similar to (B), statistical comparisons of the population diversity index among the different lineages, grouping values by disease and tissues.

