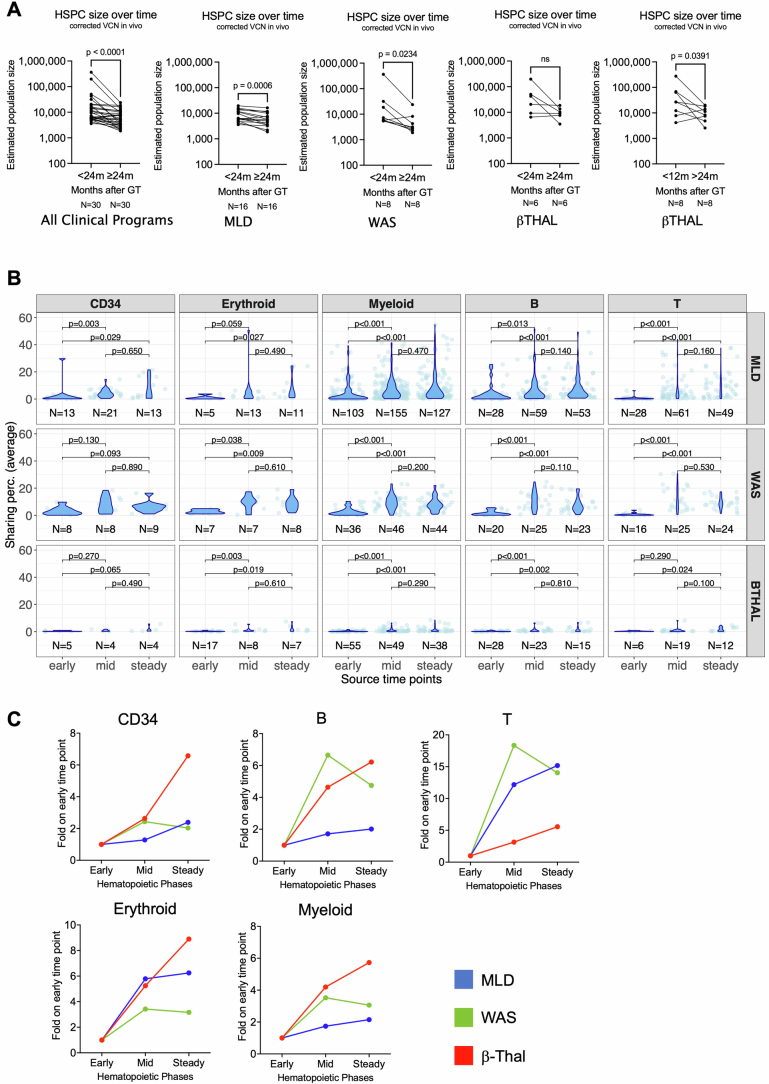
Extended Data Fig. 3. HSPC population size.
(A) Estimated number of HSPCs (y-axis) by disease comparing early time points (<24 months post GT) and late time points (>24 months post GT) using Wilcoxon matched pairs signed rank test. β-Thal patients showed not statistically significant decrease when comparing <24 Vs. >24 months, while showed a significant decrease when comparing <12 Vs. >24 months. (B) Statistical analysis of the composition of long-lasting clones analyzed by the time of origin (first observed time point). For each lineage (in columns) and clinical trial (in rows), we plot the percentages of shared ISs (in dots, distributions with violin plots) within each time point grouped by the three phases (“early” from 1 to 6 months after GT, “mid” from 12 to 18 months, and “steady” from 24 to 30 months). P-values obtained by Kruskal Wallis test. (C) Percentages of the composition of long-lasting clones analyzed by the time of origin expressed as fold change (y-axis) of the “mid” and “steady” phase on the “early” phase (x-axis) for the three diseases (MLD in blue, WAS in green, β-Thal in red), separated by lineage.

