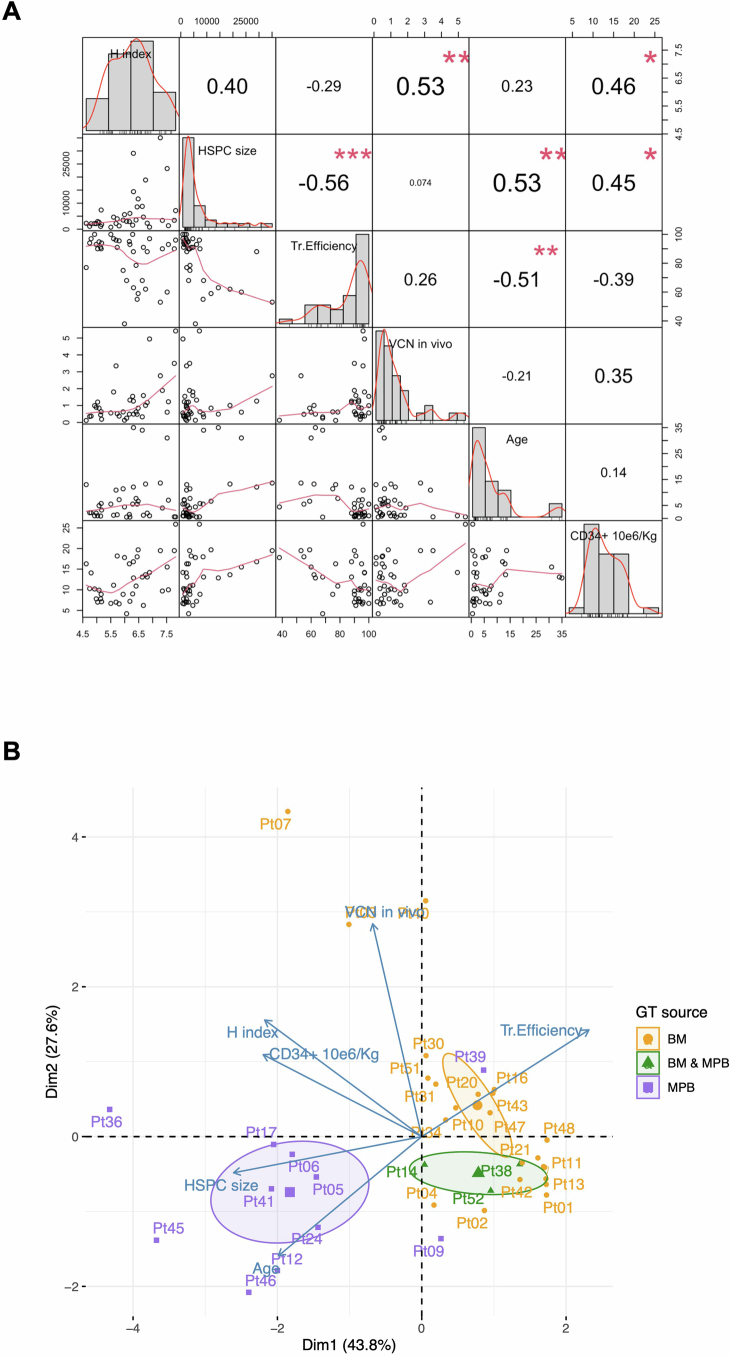
Extended Data Fig. 4. Integrated and unsupervised analysis of patients’ variables, combining clinical and molecular data.
(A) Pair-wise correlation results among all variables (represented in the diagonal). The distribution of each variable is shown within each box in the diagonal. On the lower triangular below the diagonal, the bivariate scatter plots with a fitted line. On the upper triangular side of the matrix above the diagonal, the value of the correlation plus the significance level (p-values, adjusted Benjamini). (B) PCA analysis with biplot representation showing on the axes the first 2 dimensions explaining >74% of the data; dots are all patients labeled with patient ID; blue arrows are the eigenvectors of the PCA; in colors the three GT types (BM = bone marrow, MPB = mobilized peripheral blood) with centroids of clustering as elliptic shapes.

