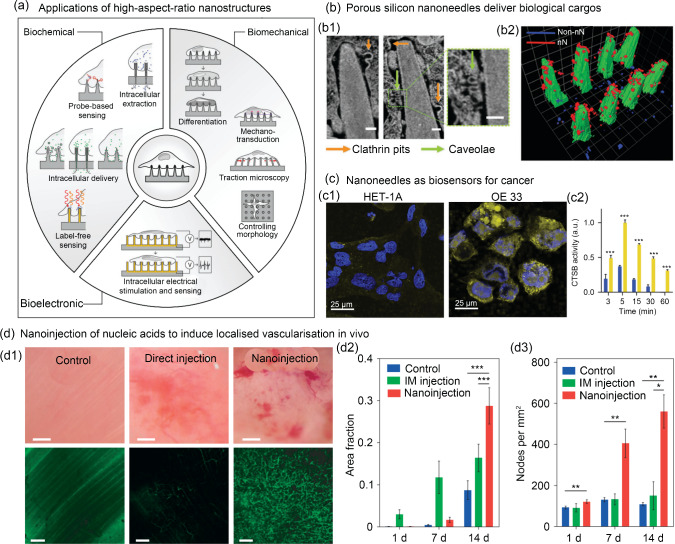
Fig. 12.
Engineered nanotopographies as minimally invasive nanotools for cargo delivery, biosensing, and in vivo cell reprogramming. a Schematic representation of the diverse applications of high-aspect-ratio nanostructured surfaces which leverage intimate contact between the substrate material and cell membrane (reproduced from Ref. [165], Copyright 2020, with permission from WILEY–VCH Verlag GmbH & Co. KGaA, Weinheim). b Nanoneedles have been employed to deliver specific cargo which elucidated uptake mechanisms: b1 focused-ion-beam scanning electron microscope (SEM) imaging demonstrated cell membrane interaction with nanostructures with the formation of two classes of endocytic vesicles clathrin pits (orange arrows) and caveolae (green arrows) (scale bars: 100 nm); b2 the organisation of vesicle structures on nanoneedles (red) and non-nanoneedle locations (blue) was achieved using 3D reconstruction. Reproduced from Ref. [166], Copyright 2019, with permission from the authors, licensed under CC BY. c Nanoneedles have been used to detect cancerous cells (OE 33) based on cytosolic levels of cathepsin B (CTSB): c1 representative images of a single z-plane through the cytosol of CTSB − ve (HET-1A) and + ve (OE 33) cells where yellow fluorescence arises from CTSB mediated cleavage of a fluorescent probe on the nanopatterned substrate and blue is the nuclei (scale bars: 25 µm); c2 quantification of the area-normalised cytosolic fluorescence signal for OE 33 (yellow) and HET-1A (blue) when interfaced with nanoneedle sensors for various times (x-axis). Reproduced from Ref. [171], Copyright 2015, with permission from the authors, licensed under CC BY. d Nanoneedles have enabled the in vivo delivery of a growth-factor-encoding plasmid. d1 Bright-field (top) and confocal (bottom) microscopy showing vasculature within muscles of untreated (control) and human vascular endothelial growth factor (hVEGF)-165 treated (direct-injection and nanoinjection). Fluorescent signal is from systemically injected fluorescein isothiocyanate (FITC)-dextran (scale bars: 100 µm for bright-field and 50 µm for confocal). Vessel quantification is demonstrated by d2 the fraction of fluorescent signal and d3 the number of nodes in the vasculature per mm2. Reproduced from Ref. [167], Copyright 2015, with permission from Macmillan Publishers Limited

