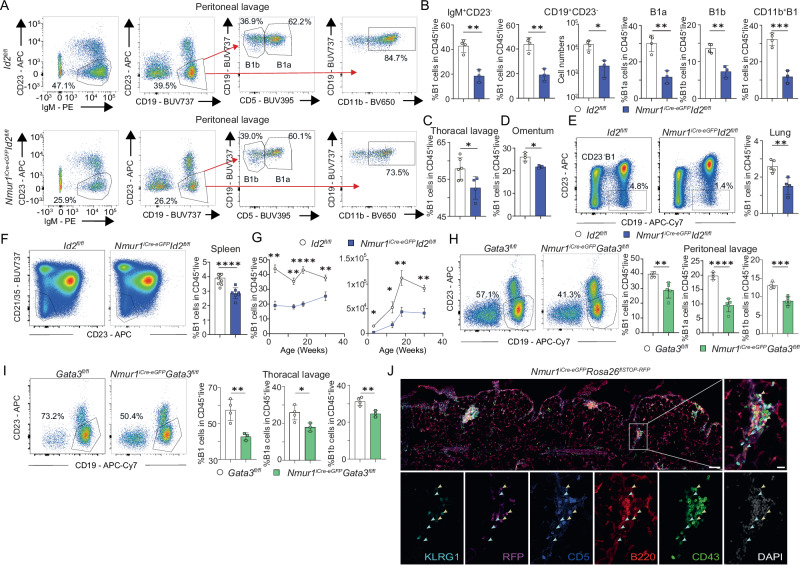
Fig. 1. ILC2s shape the B1 cell pool.
a Flow cytometric plots of B1 cells in Nmur1iCre-eGFP Id2fl/fl (blue) and littermate Id2fl/fl mice (white) in the peritoneal cavity in steady state. B1 cells were pre-gated on live CD45+ TCRβ-. First gate shows B1 cells gated as IgM+ CD23−. Second gate shows B1 cells gated as CD19+ CD23−, further gating of B1 cells included CD11b. B1a and B1b cells were subdivided using the marker CD5. b Quantification of B1 cells as in (a) (Id2fl/fl n = 4, Nmur1iCre-eGFP Id2fl/fl n = 3). c–f Flow cytometric plots and quantification of B1 cells in the (c), Thoracal lavage (Id2fl/fl n = 6, Nmur1iCre-eGFP Id2fl/fl n = 4), d Omentum (Id2fl/fl n = 4, Nmur1iCre-eGFP Id2fl/fl n = 3) e Lung (Id2fl/fl n = 5, Nmur1iCre-eGFP Id2fl/fl n = 4) and (f) spleen (Id2fl/fl n = 8, Nmur1iCre-eGFP Id2fl/fl n = 7). g Relative and absolute cell numbers of B1 cells across different ages in Nmur1iCre-eGFP Id2fl/fl (blue, 3 weeks n = 3, 13 weeks n = 4, 18 weeks n = 5, 30 weeks n = 4) and littermate Id2fl/fl mice (black, 3 weeks n = 4, 13 weeks n = 4, 18 weeks n = 4, 30 weeks n = 5). h, i Flow cytometric plots of B1 cells in Nmur1iCre-eGFP Gata3fl/fl (green) and littermate Gata3fl/fl (white) mice in the (h), peritoneal cavity (Gata3fl/fl n = 4, Nmur1iCre-eGFP Id2fl/fl n = 5) and (i), thoracal lavage (Gata3fl/fl n = 4, Nmur1iCre-eGFP Id2fl/fl n = 3) at steady state. j Histology section of omental Fat-Associated-Lymphoid-Clusters (FALCs) from the ILC2 reporter mouse Nmur1iCre-eGFP Rosa26flSTOP-RFP/+ (violet signal) stained with anti-KLRG1 (light-blue), anti-CD5 (dark blue), anti-B220 (red), anti-CD43 (green), and DAPI. Yellow arrows identify ILC2s (RFP+ KLRG1+ CD5−), blue arrows point towards B1 cells (B220low, CD43+). Scale bar overview 100 µm, zoom 20 µm. Each symbol represents data from one mouse, mean +/− SD, all data are representative of at least two independent experiments. Statistical significance was determined by two-tailed unpaired Student’s t-test (b–i), *p < 0.05 **p < 0.01, ***p < 0.001, ****p < 0.0001. Source data, including exact p-values, are provided as a Source data file Fig. 1.

