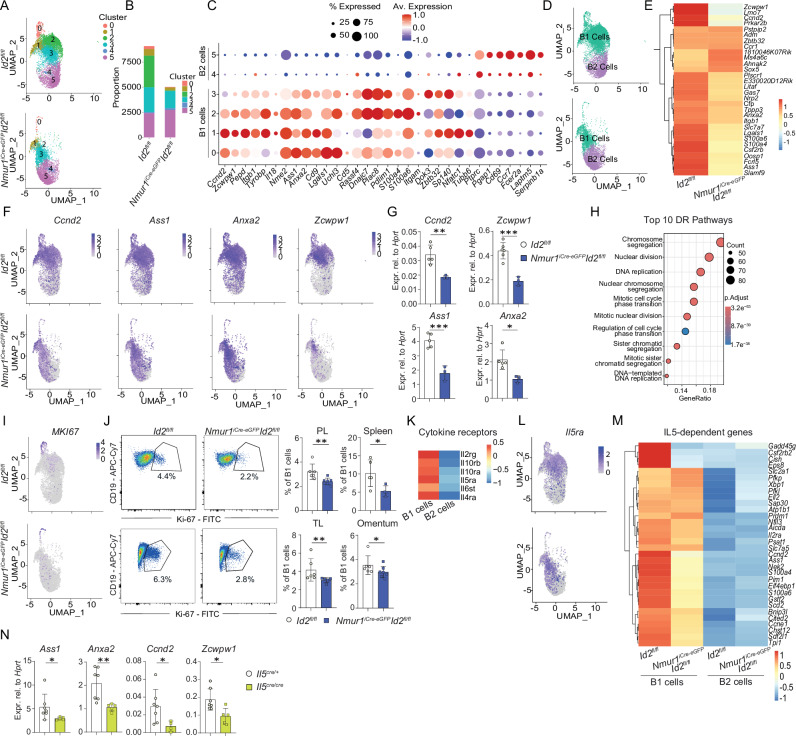
Fig. 2. ILC2s expand IL5ra+ B1 cells.
a Clustering of flow-sorted and sequenced B cells at a resolution 0.3. b Proportions of the clusters of Nmur1iCre-eGFP Id2fl/fl vs. littermate Id2fl/fl mice. c B1- and B2-specific genes in each Cluster were plotted according to their average expression and percentage of expression. d Annotated and color-coded B1 vs. B2 cells. e Heatmap of top 30 differentially-expressed genes in B1 cells of Nmur1iCre-eGFP Id2fl/fl vs. littermate Id2fl/fl mice. f UMAPs of Ccnd2, Ass1, Anxa2, Zcwpw1. g Validation by qPCR of downregulated B1 cell genes. B1 cells were sort-purified from the peritoneal cavity (Id2fl/fl n = 5, Nmur1iCre-eGFP Id2fl/fl n = 3). h Top 10 differentially-regulated pathways in Cluster 0 of the UMAP in a. i UMAP showing Mki67 in B cells, j flow cytometric plots and quantification of Ki67+ B1 cells (Pre-gated on Live CD45+ CD19+ CD23-) in Nmur1iCre-eGFP Id2fl/fl (blue, PL, peritoneal lavage n = 7, TL, thoracal lavage n = 5, Spleen n = 4, Omentum n = 7) and littermate Id2flox/flox mice (white, PL n = 6, TL n = 6, Spleen n = 5, Omentum n = 6). k Expression of cytokine-receptors on B1 and B2 cells in ILC2-sufficient mice. l UMAP of IL5ra+ B cells. m differentially- regulated gene expression of reported IL-5-induced B1 cell genes21 of Nmur1iCre-eGFP Id2fl/fl vs. (blue) and littermate Id2flox/flox mice. n B1 cells were sort-purified from Il5Cre/Cre (yellow, n = 5) and littermate Il5Cre/+ mice (white, n = 7) and qPCR was performed for the indicated genes. Each symbol represents data from one mouse, mean +/− SD, data in (g, j, n) are representative of two independent experiments. Statistical significance was determined by two-tailed unpaired Student’s t-test (g) or Mann Whitney test (j, n), *p < 0.05 **p < 0.01, ***p < 0.001, ****p < 0.0001. Source data, including exact p-values, are provided as a Source data file Fig. 2.

