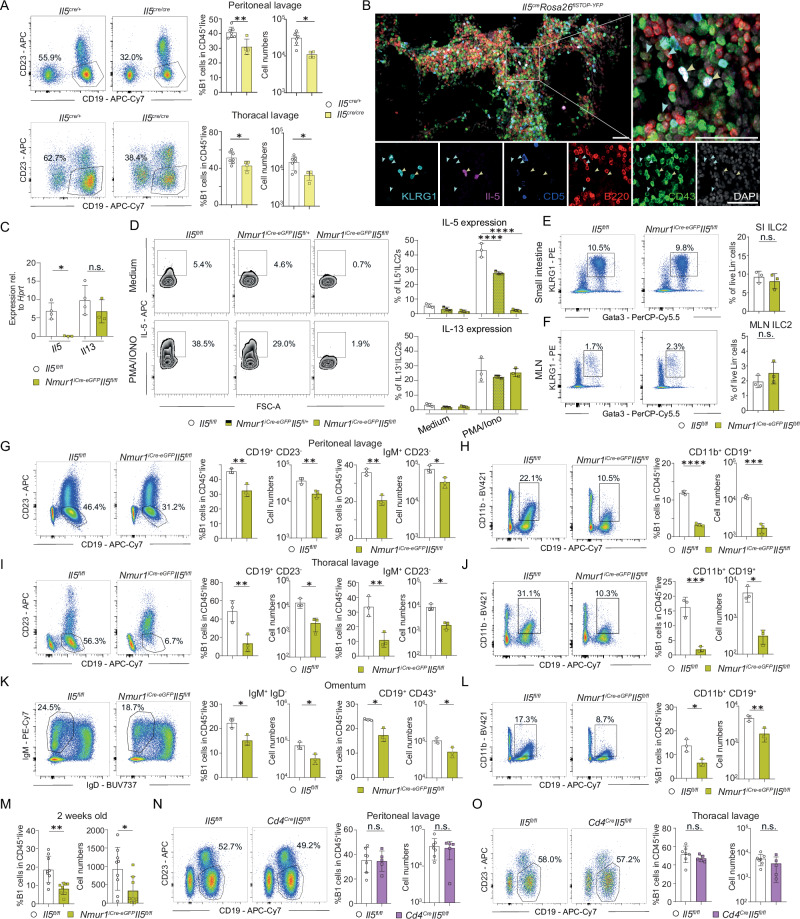
Fig. 3. ILC2-derived IL-5 is required for proper B1 cell development.
a Flow cytometric plots and quantification of B1 cells in Il5Cre/Cre (yellow, n = 4) and littermate Il5Cre/+ mice (white, n = 7) in the peritoneal cavity and thoracal lavage at steady state. b Histology section of omental FALCs from Il5Cre/+ Rosa26flSTOP-YFP/+ mice. Staining with anti-B220 (red), anti-CD43 (green), anti-KLRG1 (light-blue), anti-CD5 (blue), endogenous IL-5 (Violet) and DAPI. Il-5 producing ILC2s (yellow arrows, Il5+KLRG1+CD5-) reside in close proximity to B1 cells (blue arrows, B220lowCD43+). Scale bars 50 µm. c Validation of the mouse line Nmur1iCre-eGFP Il5fl/fl by qPCR of sort-purified ILC2s from the lung (Il5fl/fl n = 4, Nmur1iCre-eGFP Il5fl/fl n = 3). d IL-5 and Il-13 secretion was determined by flow cytometry of cultured immune cells isolated from the small intestine of Nmur1iCre-eGFP Il5fl/fl mice and littermate controls, stimulated with PMA/ionomycin (PMA/Iono) for 4 h (Il5fl/fl n = 3, Nmur1iCre-eGFP Il5fl/+ n = 3, Nmur1iCre-eGFP Il5fl/fl n = 3). e, f Relative ILC2 numbers in the (e), small intestine and (f), mesenteric lymph nodes (MLN) (Il5fl/fl n = 3, Nmur1iCre-eGFP Il5fl/fl n = 3). g–l Flow cytometric plots and quantification (Il5fl/fl n = 3, Nmur1iCre-eGFP Il5fl/fl n = 3) of (g, i, k), B1 cells (cells were pre-gated on live CD45+ TCRβ−) and (h, j, l), CD11b+ B1 cells in the (g, h) peritoneal lavage, (i, j), the thoracal lavage and (k, l), the omentum. m Flow cytometric quantification of B1 cells in 2 weeks old Nmur1iCre-eGFP Il5fl/fl mice and littermate controls (Il5fl/fl n = 9, Nmur1iCre-eGFP Il5fl/fl n = 8). n, o Flow cytometric plots and quantification of B1 cells in the (n), peritoneal cavity and the (o), thoracal lavage in littermate, co-housed Cd4Cre Il5fl/fl mice and controls (Il5fl/fl n = 7, Cd4Cre Il5fl/fl n = 5). Each symbol represents data from one mouse, mean +/− SD, all data are representative of at least two independent experiments. Statistical significance was determined by two-tailed unpaired Student’s t-test (a, e–o) or one-way ANOVA (c, d), n.s. non-significant, *p < 0.05, **p < 0.01, ***p < 0.001, ****p < 0.0001. Source data, including exact p-values, are provided as a Source data file Fig. 3.

