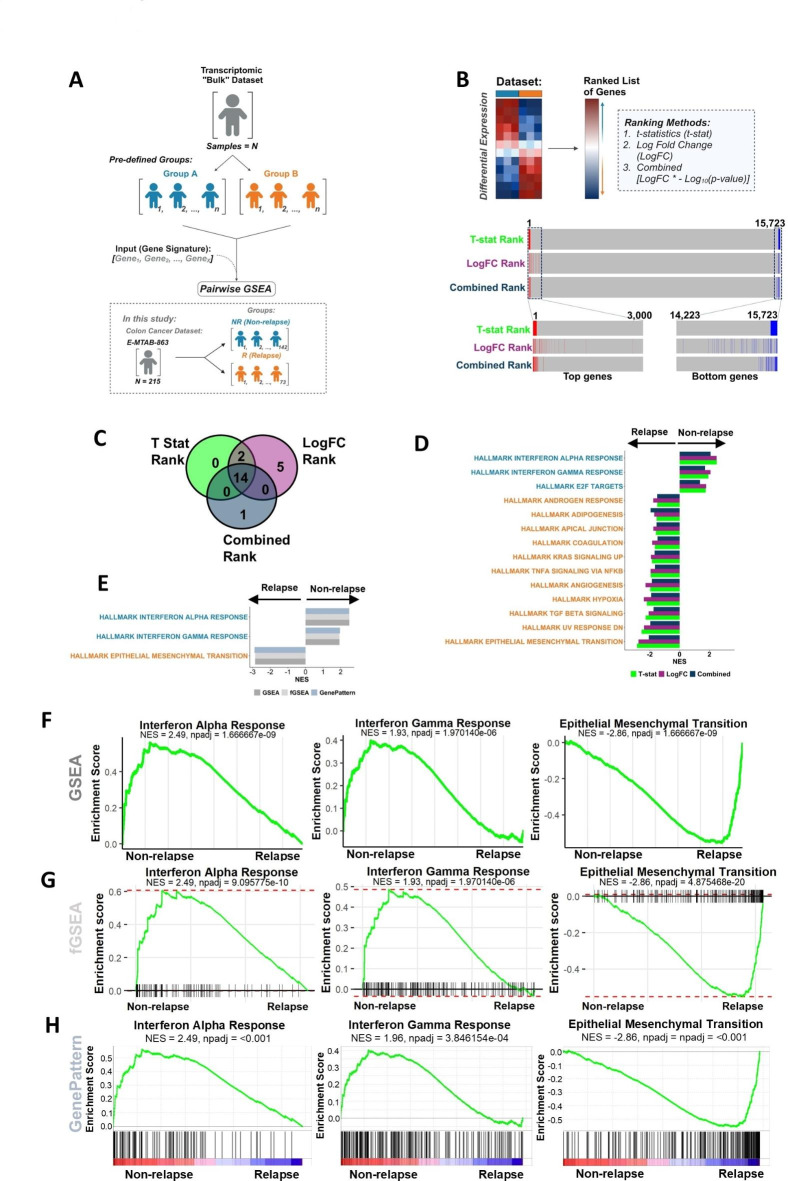
Fig. 1.
Differential gene expression analysis and pairwise analysis of the discovery cohort. (A) Schematic of the differential expression analysis and pairwise analysis. (B) Workflow of differential expression analysis and ranked position of the top 100 differentially expressed genes and bottom 100 genes in NR when ranked by t-stat and the position of these genes when ranked by LogFC and combined. (C) Venn diagram of the significant Hallmark signatures (padj < 0.05) from GSEA when genes were ranked by t-stat, LogFC, and combined. (D) Significant Hallmark signatures (padj < 0.05) identified from clusterProfiler GSEA when genes were ranked by t-stat, LogFC, and LogFC combined with the p-value ordered by NES. (E) clusterProfiler GSEA, fGSEA, and GenePattern pre-ranked GSEA of the significant Hallmark gene sets. Enrichment plots from (F) clusterProfiler GSEA, (G) fGSEA, (H) GenePattern comparing NR CC (n = 142) to R CC (n = 73) for Interferon Alpha Response, Interferon Gamma Response and EMT.

