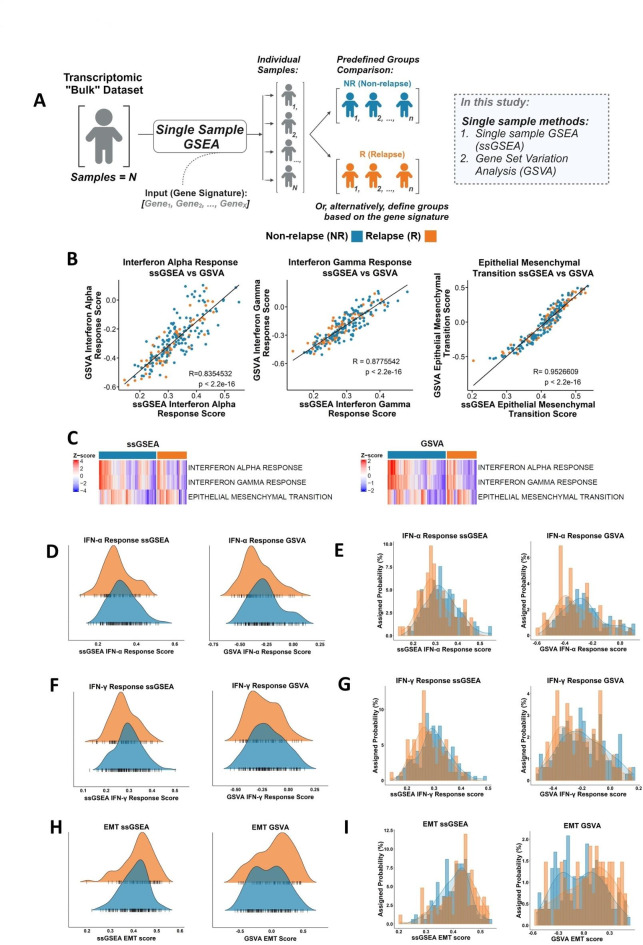
Fig. 2.
Comparison of the single sample methods, ssGSEA and GSVA. (A) Schematic of standard single sample analysis workflow. (B) Scatterplot showing the correlation of ssGSEA and GSVA scores for the Hallmark Interferon Alpha Response (Pearson correlation coefficient, R = 0.835), Interferon Gamma Response (R = 0.878) and EMT (R = 0.953). (C) Heatmap of ssGSEA and GSVA scores for Interferon Alpha Response, Interferon Gamma Response and EMT comparing NR and R. Distribution of the ssGSEA and GSVA scores for the Interferon Alpha Response signature in the R (orange) and NR (blue) samples using (D) kernel density and (E) histograms. Distribution of the ssGSEA and GSVA scores for the Interferon Gamma Response signature in the R (orange) and NR (blue) samples using (F) kernel density and (G) histograms. Distribution of the ssGSEA and GSVA scores for the EMT signature in the R (orange) and NR (blue) samples using (H) kernel density and (I) histograms.

