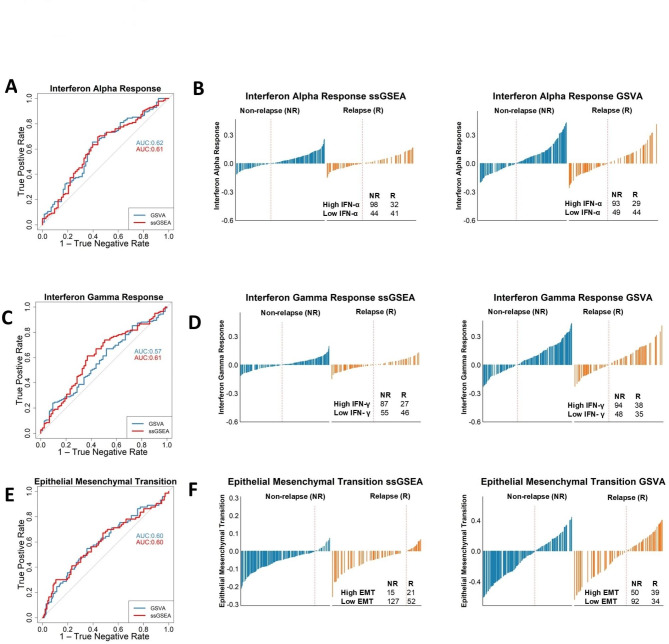
Fig 3.
Application of single sample analysis as a predictor for relapse. (A) ROC curve using Interferon Alpha Response ssGSEA and GSVA scores to predict NR had an AUC ranging between 0.61 and 0.62. True positive rate is when the sample is classified as high Interferon Alpha Response, and the case was a NR. The true negative rate is the proportion of true negatives, when a sample is a NR cases without high Interferon Alpha Response. (B) Interferon Alpha Response waterfall plots show when stratified into high and low groups for the Interferon Alpha Response with both ssGSEA and GSVA scores, we found a greater number of NR patients classed as high (n = 98 [75.4%], n = 92 [76.0%]) respectively compared to R (n = 32 [24.6%], n = 29 [24.0%]) respectively. (C) Interferon Gamma Response ROC AUC values ranging between 0.57 and 0.61. True positive rate is when the sample is classified as high Interferon Gamma Response, and the case was a NR. The true negative rate is the proportion of true negatives, when a sample is a NR cases with a low Interferon Gamma Response score. (D) Interferon Gamma Response waterfall plots show when stratified into high and low groups for the Interferon Gamma Response with both ssGSEA and GSVA scores, there were greater number of NR patients classed as high (n = 86 [76.1%]; n = 95 [71.4%] respectively compared to R (n = 27 [23.9%]; n = 38 [28.6%] respectively. (E) EMT ROC AUC values of 0.60. True positive rate is when the sample is classified as high EMT, and the case was a relapse. The true negative rate is the proportion of true negatives, when a sample is a NR case with a low EMT score. (F) EMT waterfall plots show when stratified into high and low for EMT for ssGSEA we found that a greater number of R patients classified as high (n = 22 [59.5%], compared to NR (n = 15 [40.5%]). GSVA found a higher number of NR patients with a high EMT score (n = 50 [56.2%]) compared to R (n = 39 [43.8%]).

