Fig. 4.
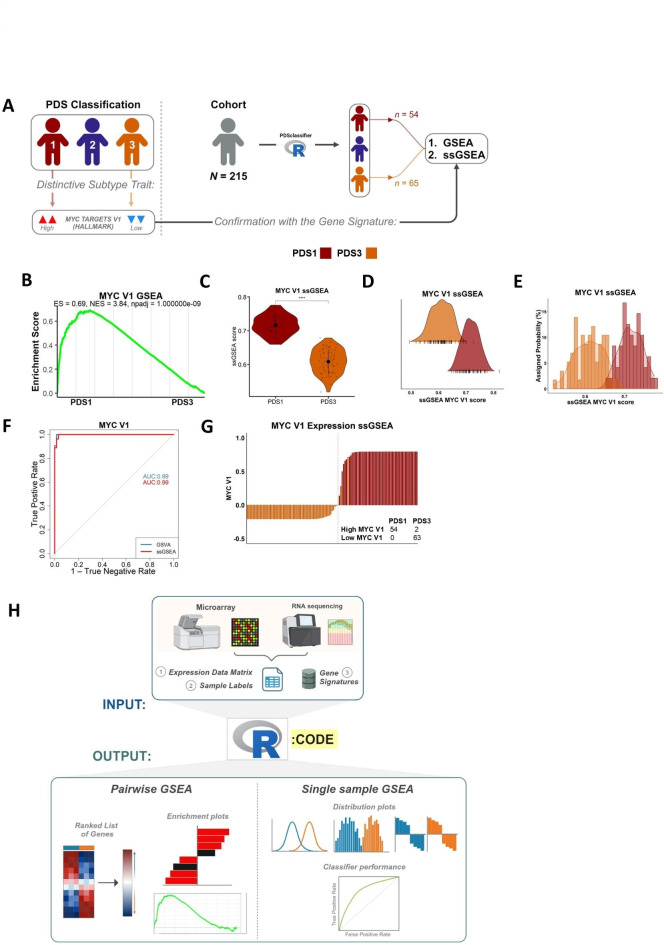
The use of single sample analysis provides distinct biology between groups. (A) Schematic of application of pathway analysis methods when applied to PDS classification. (B) GSEA revealed MYC targets V1 is enriched in the PDS1 group compared to the PDS3 group. (C) ssGSEA scores show significant difference of MYC targets V1 between PDS1 and PDS3 groups (****padj < 0.0001). (D & E) ssGSEA scores for PDS1 and PDS3 show little overlap of MYC targets V1 between groups. (F) ROC curve shows that the MYC V1 scores enable discrimination between PDS1 and PDS3. AUC value of 0.99. True positive rate is when the sample is classified as high MYC V1, and the case was PDS1. The true negative rate is the proportion of true negatives, when a sample is a PDS1 without high MYC V1. (G) Stratification of MYC V1 high and MYC V1 low ssGSEA scores showed that PDS1 was classified as high MYC V1 (n = 54 [96.4%] and PDS3 contained only samples with a low MYC V1 score (n = 63 [100%]). (H) Overall schematic for dualGSEA workflow.

