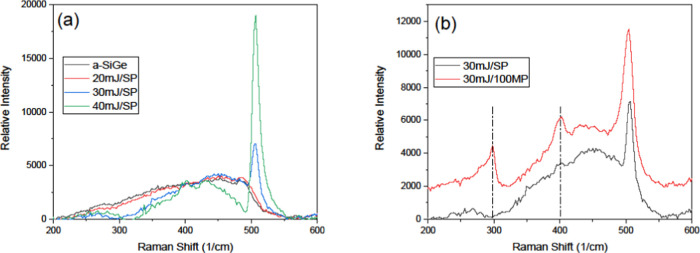
Figure 5.
(a) Raman scattering spectra of the as-deposited a-SiGe layer, and of layers postprocessed using a single pulse of energy from 20 to 40 mJ. (b) Raman spectra for a layer processed with a single pulse of 30 mJ and one processed with 100 pulses (MP) of the same energy per pulse, stacked for clarity. The dashed lines indicate the location of Si–Ge and Ge–Ge interactions.

