
Fig. 2. Single-molecule tracking shows that ZntRapo enhances the kinetics of ZurZn unbinding from DNA in cells.
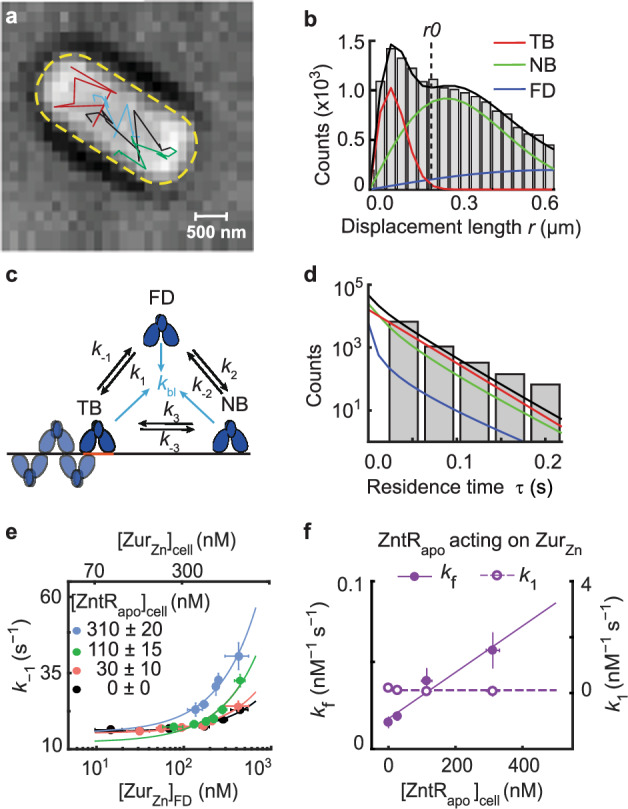
a Exemplary single-molecule tracking trajectories (colored lines) overlaid on the bright-field transmission image of a live E. coli cell from a strain expressing both ZurmE and from plasmids grown in the presence of 20 µM Zn2+. 16 biological replicates were conducted and in total 211,838 tracking trajectories were imaged in 4267 cells. Yellow dashed line: cell contour. b Exemplary distribution of 20454 displacement lengths r per time lapse (40 ms) for in cells having ~250 nM ZurmE and ~30 nM from a strain expressing both ZurmE and from plasmids grown in the presence of 20 µM Zn2+. Solid lines: the overall fit (black), and the resolved TB, NB, and FD diffusion states (Supplementary Notes 3). Vertical dashed line: the displacement threshold r0 below which >99.5% TB state is included. Bin width is 0.034 µm. c 3-state kinetic model for Zur-DNA interactions in cell. k’s: rate constants. d Histogram of 8435 microscopic residence time τ of in cells having ~250 nM ZurmE and ~30 nM . Black line: fit with Supplementary Eq. S12; the deconvoluted contributions from the three diffusion states are in red, green, and blue as color-coded in b. Bin width is 0.044 s. e Dependence of the apparent unbinding rate constant k−1 of on its own concentration and at different [] in the cell (black: n = 1379 cells; orange: n = 1152 cells; green: n = 978 cells; blue: n = 505 cells). Lines: fits with Eq. (1) including 1st and 3rd terms only. f The facilitated unbinding rate constant kf (solid circle) and the binding rate constant k1 (open circle) of vs. cellular [] (n = 4267 cells). Solid line: linear fit; dashed line: horizontal line fit. Error bars in (e–f) are SEM. Source data are provided as a Source Data file and also available in Supplementary Table 7.