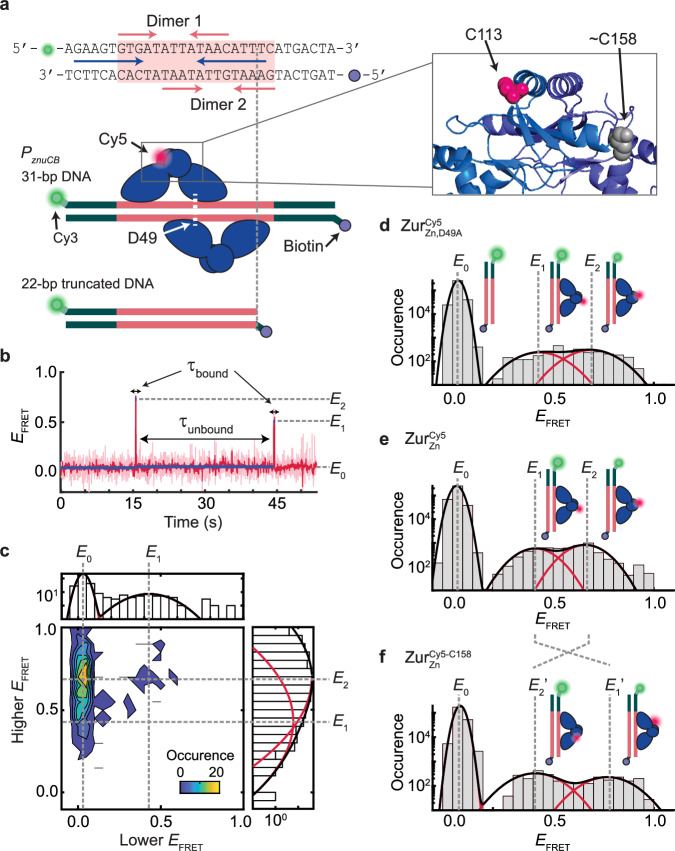
Fig. 3. SmFRET measurements show dynamic ZurZn-DNA interactions in vitro.
a Top: the DNA oligomer sequence from E. coli znuCB promoter and Cy3/biotin label positions for smFRET measurements. Pink shade: Zur box; pink arrows: two dyads for binding two ZurZn dimers; blue arrows: potential ZntR recognition dyad (Fig. 1b). Bottom: Two different-length DNA constructs. A single Cy5 is labeled at C113 or C158 on Zur. Zoom-in box: C113 and approximate C158 positions (shown on different monomers for clarity) in the dimeric ZurZn’s crystal structure (PDB: 4MTD44; residues 153-171 are unresolved). b Representative single-molecule EFRET trajectory of an immobilized 22-bp truncated DNACy3 interacting with (Cy5 at C113) (4 nM). Pink line: raw data; red line: after non-linear filtering; blue line: mean value of each EFRET state. Three EFRET states (E0, E1, E2) are denoted. Dwell times on E0 state are designated as τunbound and those on higher states (E1 and E2) as τbound. c Two-dimensional histogram of the lower vs. higher EFRET state values from single-molecule EFRET trajectories, as in (b). Top/right: corresponding one-dimensional projections; red (black) lines: Gaussian resolved (overall) fits. d Histogram of EFRET trajectories, as in (b). e Same as (d), but with (Cy5 at C113) (4 nM). f Same as (d), but with (4 nM). Cartoons in (d–f) show free DNA and DNA-bound ZurZn in two binding orientations differentiated by the Cy5-label. The FRET donor (green sphere) and acceptor (red sphere) are drawn on DNA and Zur at their approximate locations. Histograms for (d–f) are compiled from 305, 389, and 238 EFRET trajectories, respectively; bin size = 0.05. Source data are provided as a Source Data file.

