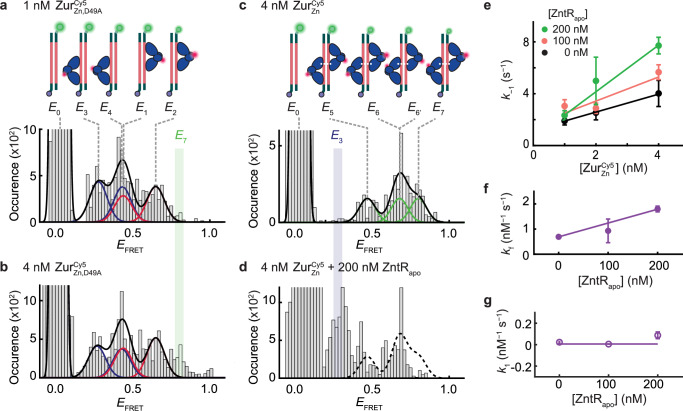
Fig. 4. ZntRapo enhances facilitated unbinding of ZurZn from DNA in vitro.
a Histogram of EFRET trajectories of immobilized 31-bp DNACy3 interacting with (1 nM). Colored lines: Gaussian resolved fits, where each color corresponds to one dimer at one of the two dyads of Zur box in two orientations, as shown by the inset cartoons. Black line: overall fit. Bin size = 0.02. b Same as (a), but with at 4 nM. E7 state (green-shaded) only appears when two dimers are bound to DNA. c Same as (a), but with (4 nM). Cartoons show DNA-bound with four different combinations of two dimer-bound form. d Same as (c) but with an introduction of unlabeled ZntRapo (200 nM). E3 state (blue-shaded) only appears when a single ZurZn dimer is bound to DNA. Histograms for (a–d) are compiled from 405, 433, 255, and 168 EFRET trajectories, respectively. e Apparent unbinding rate constant k−1 of on the 31-bp DNA vs. its own concentration at 0 (black), 100 (orange), 200 nM (green) of ZntRapo. Lines: linear fits; the slope is the facilitated unbinding rate constant kf for . kf are extracted from total 3238 dwell times. f ZntRapo-concentration-dependent kf for extracted from (e). kf are extracted from 1005, 1339, 894 dwell times for 0, 100, 200 nM of ZntRapo, respectively. Line: linear fit. g The binding rate constant k1 for to 31-bps DNA shows no significant dependence on [ZntRapo]. k1 are extracted from 249, 569, 493 dwell times for 0, 100, 200 nM of ZntRapo, respectively. Line: horizontal line fit. The binding and unbinding rate constants are extracted from single exponential fits (y = A*exp(-k*τ)) of the distributions of dwell time (Supplementary Fig. 34, 35), and their error bars are 90% confidence intervals from fits. Source data are provided as a Source Data file.

