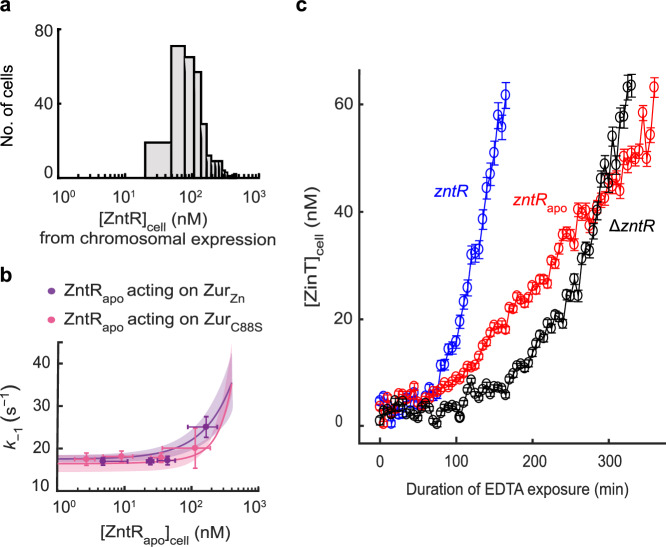
Fig. 6. ZntRapo-induced enhancement of Zur unbinding from DNA is correlated with more facile derepression of zur regulon in cells under physiological expression.
a Distribution of [ZntRmE] in the cell, when expressed solely from its chromosomal locus under our imaging condition in regular M9 media. b Dependence of the apparent unbinding rate constant of (n = 2888 cells) and of (n = 1978 cells) on [] in the cell (symbols), with both proteins in the range of their respective physiological concentrations. x, y axes both in logscale. Error bars are SEM. Lines: Simulated dependences of k−1 of ZurZn and ZurC88S on [ZntRapo] in the cell in physiological concentration ranges using Eq. S43 and experimentally determined rate constants (Supplementary Table 7); colored bands: simulated upper/lower bounds in the ranges of 119 ± 33 nM (average ± s.d.) for ZurC88S (pink) and 150 ± 48 nM for ZurZn (purple) that correspond to the physiological Zur concentrations in E. coli grown in minimal or Zn2+-supplemented media, respectively31. c Time profiles of cellular protein expression of zinTG, a Zur regulated gene, upon 2 mM EDTA treatment in chromosomal ΔzntR, zntRapo, and wild-type zntR strains. Error bars are SEM from imaging >100 cells in three independent replicates (n = 223 cells) (zntRapo, red); 220 cells (ΔzntR, black); 156 cells (wild-type zntR, blue). Source data are provided as a Source Data file.

