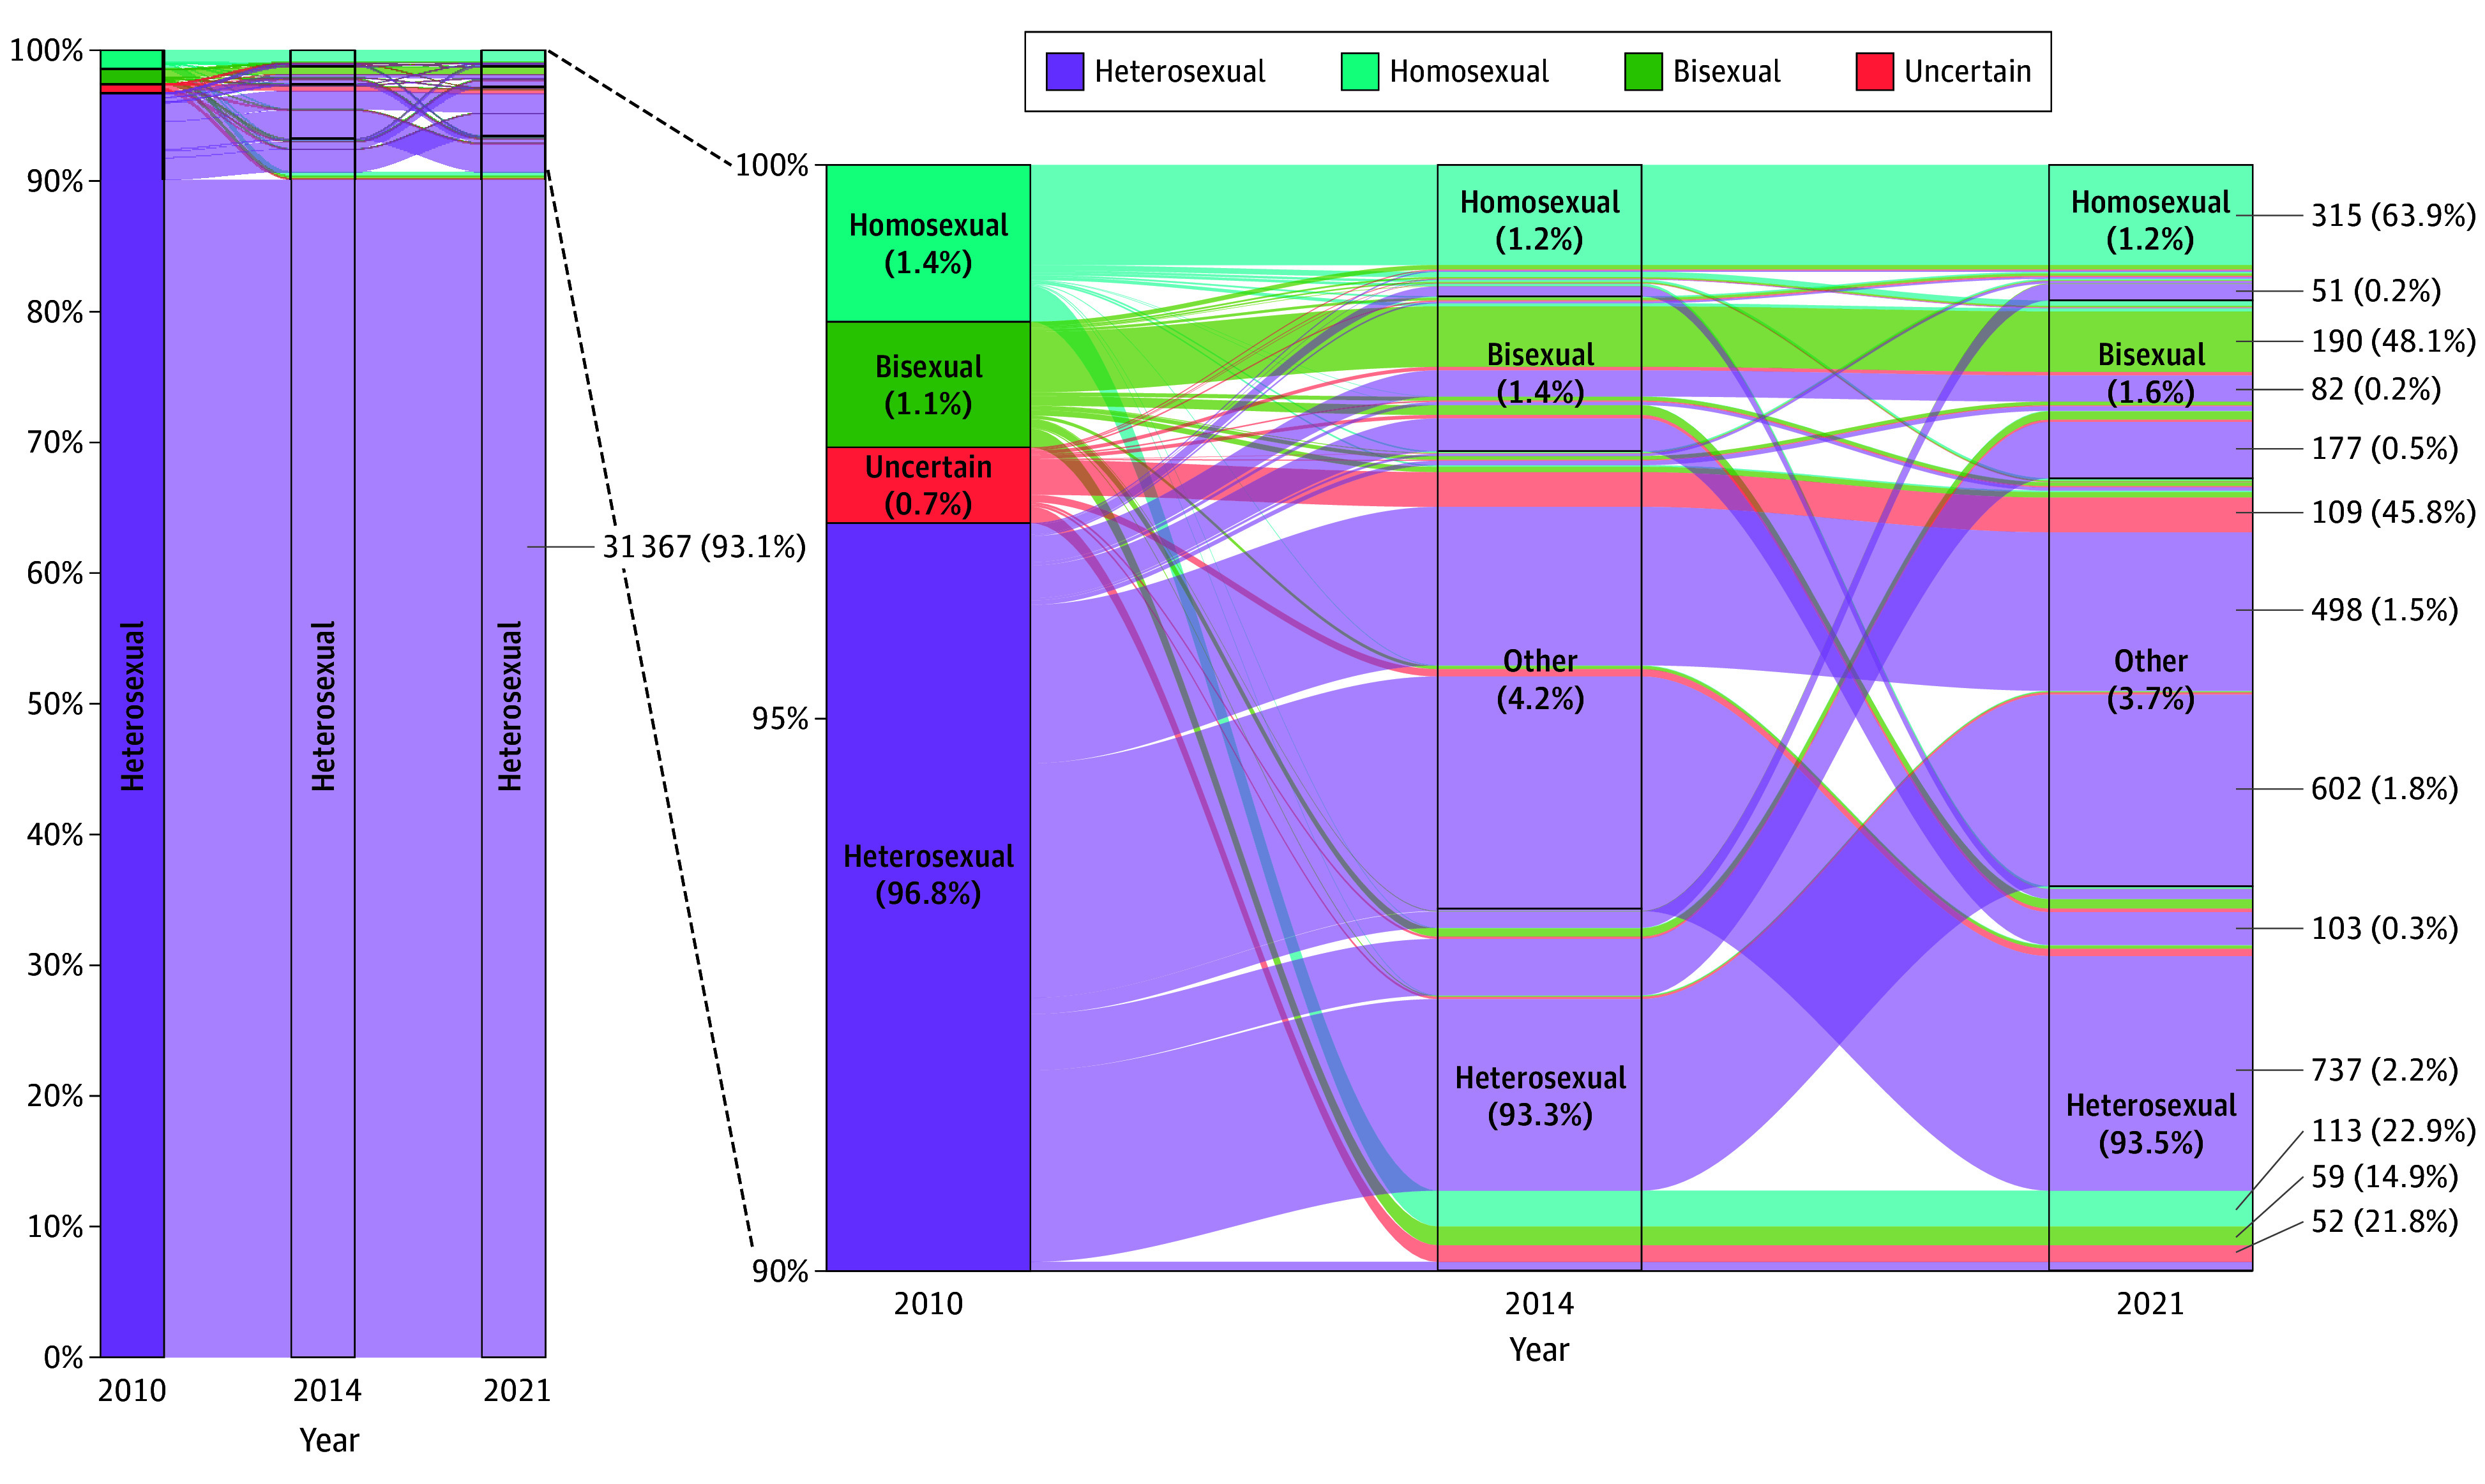
Figure 2. Individual Fluidity of Sexual Identity, 2010-2021.

Among all participants in the 2002, 2006, and 2010 cohorts who provided data on sexual identity in 2010, 2014, and 2021 (N = 34 815; eFigure 2 in Supplement 1). Other represents none of the above. The percentages within each box denote the proportions of each sexual identity in the respective survey years. In certain columns, the percentages may not total 100% due to rounding. The numbers and percentages on the right side of the plot illustrate the counts and proportions of individuals within each sexual identity group in 2010 who either retained their sexual identity or reported a change from 2010 to 2021.
