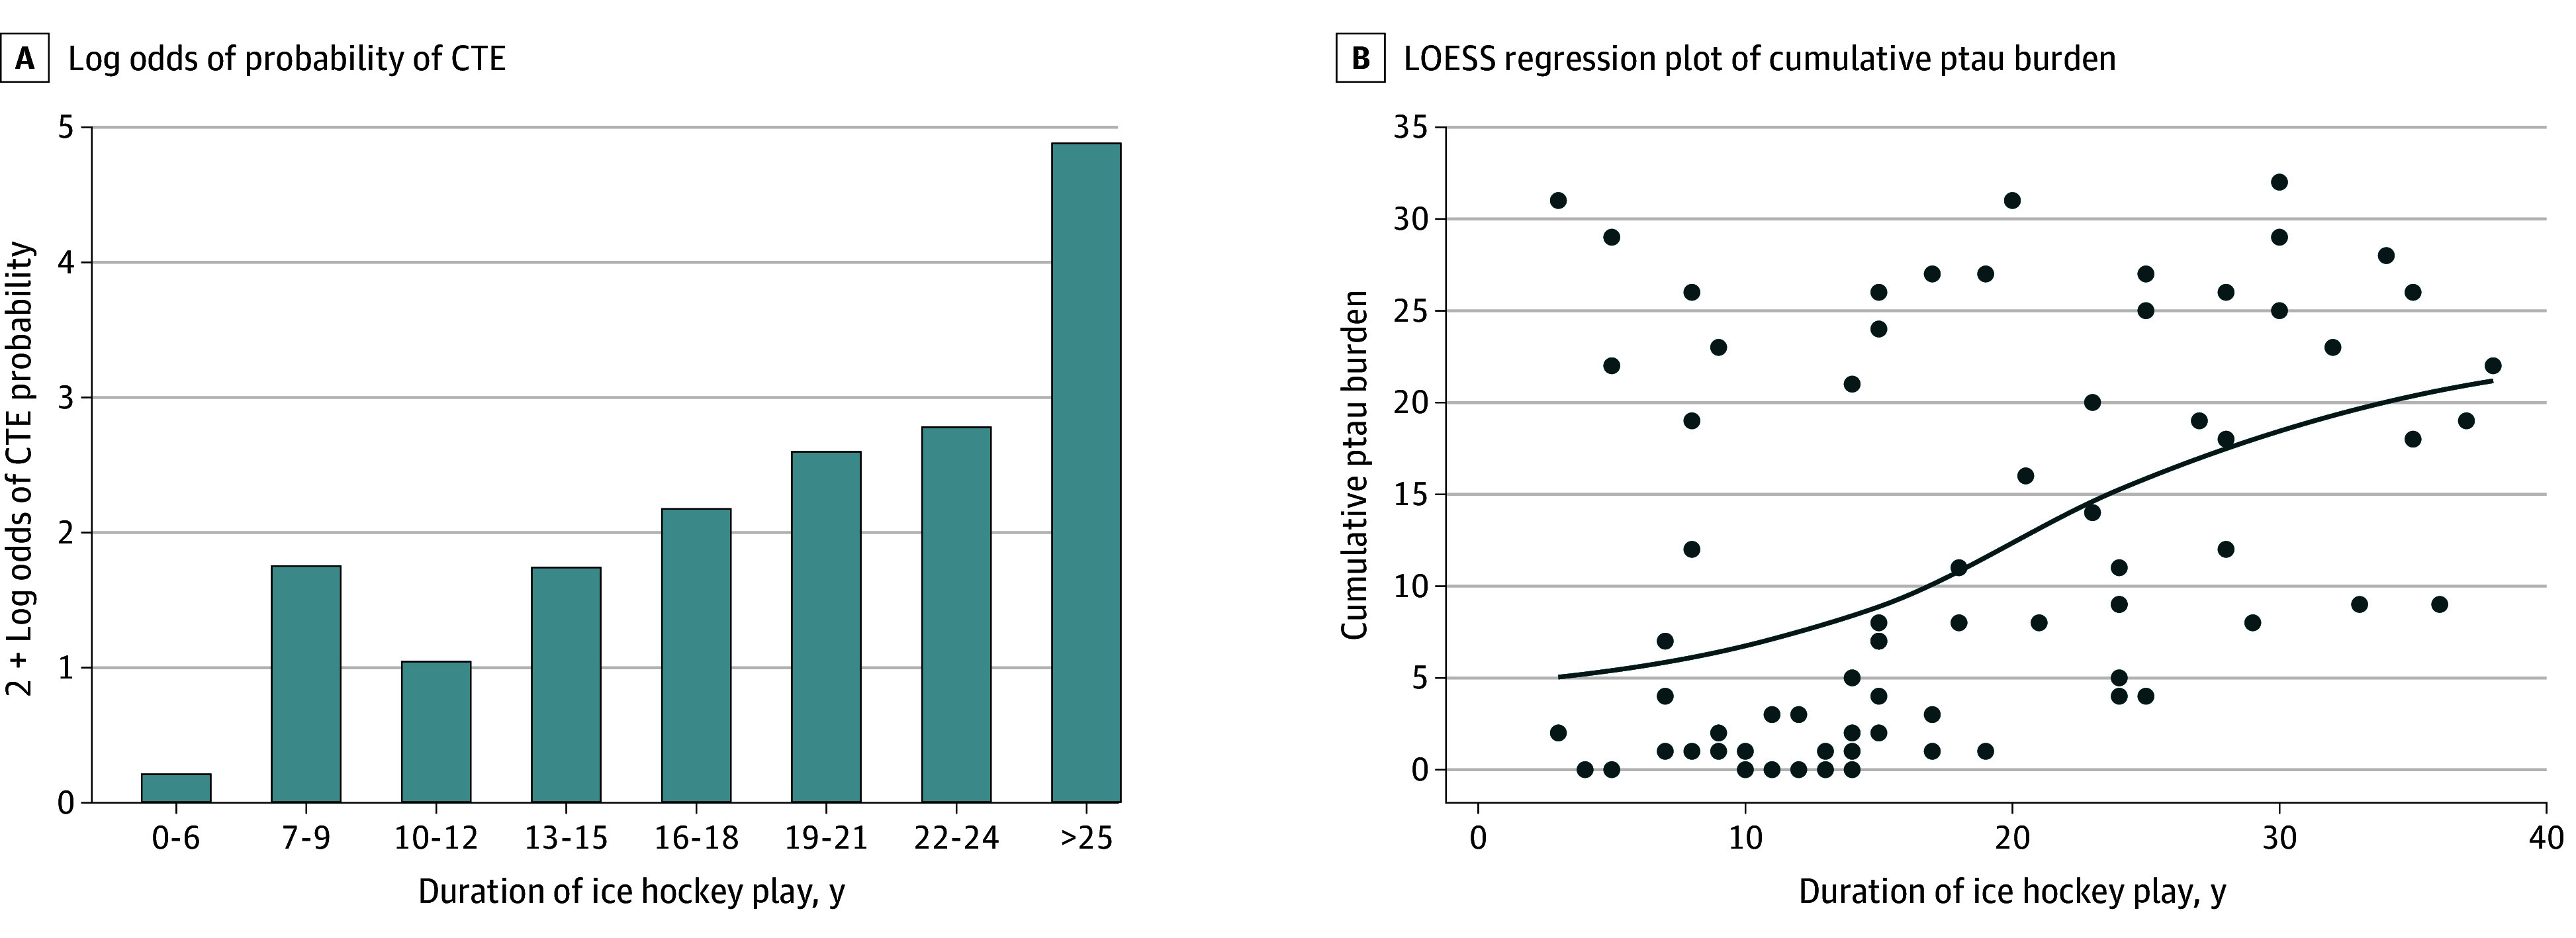
Figure 2. Evaluating Linearity Assumption.

A, The bar graph shows 2 + the log odds of the probability of chronic traumatic encephalopathy (CTE) by duration of hockey played in 3-year intervals. For durations of 0 to 6 years and 25 or more years, the log odds of CTE probability could not be calculated because no donors had CTE (for 0-6 years) or all donors had CTE (≥25 years). For the figure, log odds were calculated with probabilities of 1 of 7 CTE cases for durations of 0 to 6 years and 18 of 19 CTE cases for durations of 25 or more years. There were 0 of 6 donors, 4 of 11 donors (36.4%), 1 of 10 donors (10.0%), 5 of 14 donors (35.7%), 3 of 5 donors (60.0%), 4 of 5 donors (80.0%), 6 of 7 donors (85.7%), and 19 of 19 donors (100%) with CTE at 0 to 6, 7 to 9, 10 to 12, 13 to 15, 16 to 18, 19 to 21, 22 to 24, and 25 or more years of duration, respectively. B, The locally estimated scatterplot smoothing (LOESS) regression plot shows cumulative phosphorylated tau (ptau) burden by duration played.
