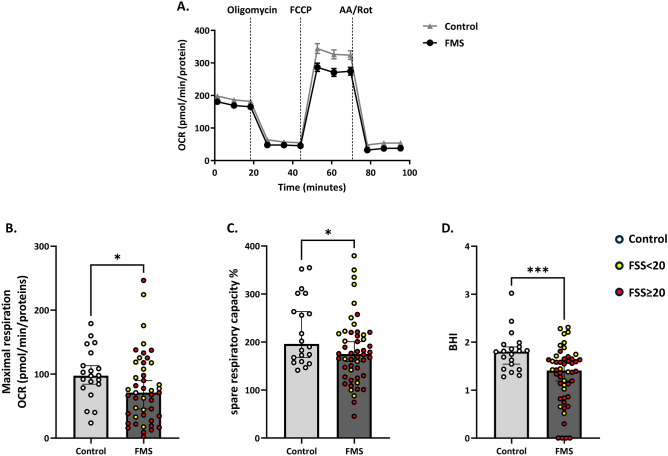
Fig. 1.
Evaluation of mitochondrial functionality in PBMC of controls and patients with fibromyalgia syndrome (FMS). Panel A) shows the oxygen consumption rate (OCR) measured through the Seahorse XF Cell Mito Stress Test. Panel B) shows maximal respiration. Panel C) shows the spare respiratory capacity (as expressed in %) and panel D) the distribution of the BHI. Light grey line and bars represent the control group (n = 20), and dark grey line and bars represent patients with FMS (n = 50). Yellow dots represent patients with FSS score < 20, while red dots represent patients with FSS score ≥ 20. Results are expressed as median (Q1, Q3). Differences between groups were assessed by Mann–Whitney U test, *p < 0.05. AA, Antimycin A; BHI, Bioenergetic Health Index; FCCP Carbonyl cyanide-4 (trifluoromethoxy) phenylhydrazone; FMS, Fibromyalgia patients; FSS, Fibromyalgia Severity Score; OCR, Oxygen Consumption Rate; PBMC, peripheral blood mononuclear cells; Rot, rotenone.

