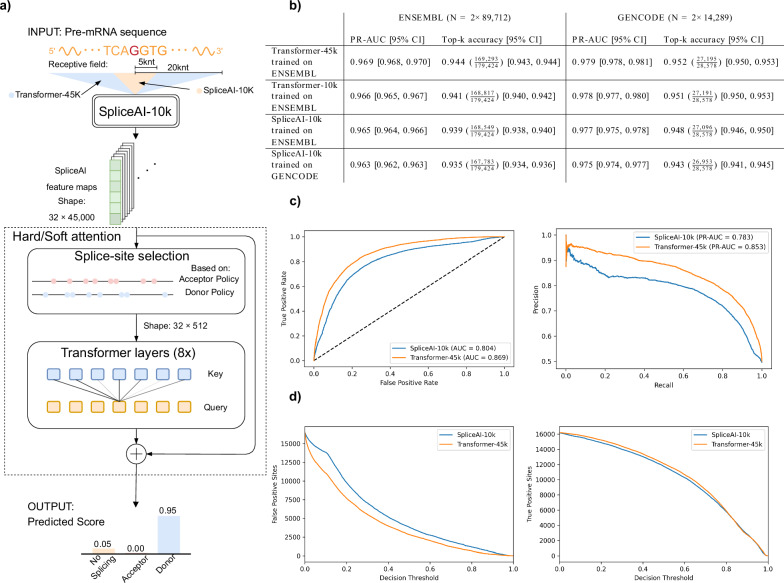
Fig. 1. A diagram showing Transformer-45k and a performance comparison with Splice-10k.
a For each position in an input DNA sequence, the method looks at the surrounding context region and outputs a predicted score for three options: no splicing, acceptor, or donor. b Comparison of Transformer-45k with SpliceAI-10k on both ENSEMBL and GENCODE annotations with regard to area under the precision-recall curve (PR-AUC) and top-k accuracy. 95% confidence intervals (CIs) are shown in brackets. N denotes the number of splice sites in the test set, not the total size. E.g., the total size of the ENSEMBL test set is 664,940,000 nt. c Receiver operating characteristic (ROC) curve and precision-recall curve for cases where SpliceAI and Transformer-45k disagree (TVD ≥0.1). d The total number of false positive and true positive splice sites as a function of the decision threshold for cases where SpliceAI and Transformer-45k disagree (TVD ≥0.1).

