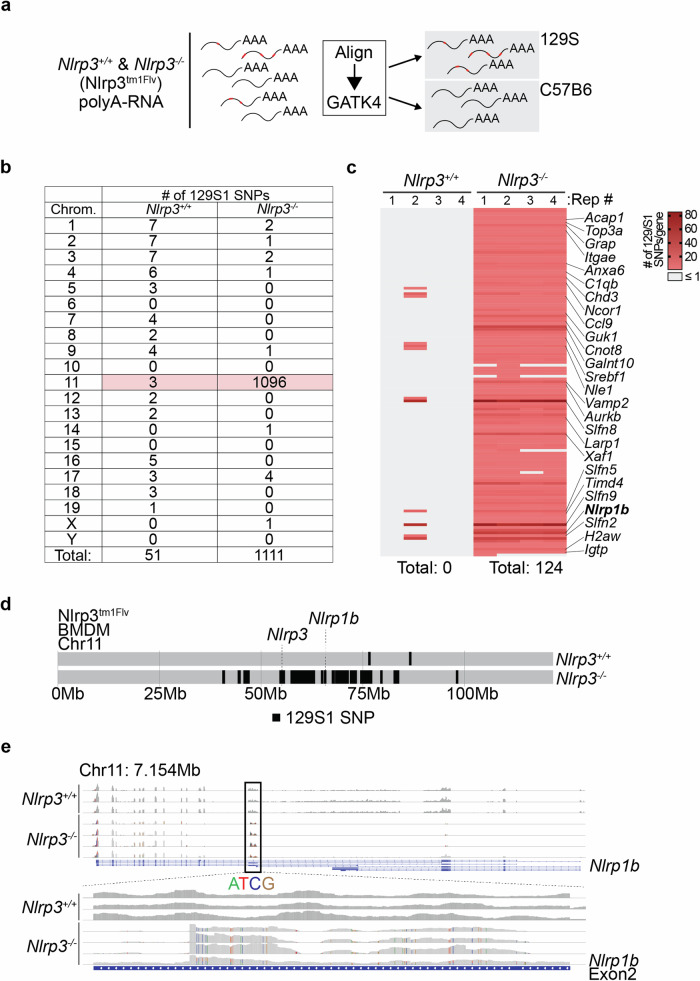
Fig. 3. Nlrp3tm1Flv mice contain a ~40 Mb region of 129S chromosome 11, including the Nlrp1129S locus.
a Schematic representation of variant calling analysis from polyA-RNAseq to identify mouse strain of origin for expressed transcripts. b Table showing the number of identified 129S1 SNPs in at least three out of four replicates in both Nlrp3+/+ and Nlrp3−/− BMDMs. Values for chromosome 11 are highlighted in red. c Heatmap showing number of 129S1 SNPs in genes located on chromosome 11 from both Nlrp3+/+ and Nlrp3−/− BMDMs. Right: subset of genes identified as containing ≥2 129S1 SNPs in at least three out of four biological replicates. Bottom: total number of genes containing ≥2 129S1 SNPs in at least three out of four biological replicates. d Line plot showing the location of Nlrp3 and Nlrp1b, and every identified SNP mapping to the 129S1 genome compared to the reference genome in RNAseq data from Nlrp3+/+ and Nlrp3−/− BMDMs on chromosome 11. Based on presence in three out of four biological replicates in each genotype. e Snapshot from the Integrative Genomics Viewer (IGV) showing RNAseq reads of Nlrp1b from Nlrp3+/+ and Nlrp3−/− BMDMs at baseline. Top: read coverage over the whole Nlrp1b gene (expression range: 0–300). Bottom: zoom view of reads at exon 2 of Nlrp1b (expression range: 0–100). SNPs are highlighted in separate colours (adenine (A) = green, thymine (T) = red, cytosine (C) = blue, guanine (G) = brown).

