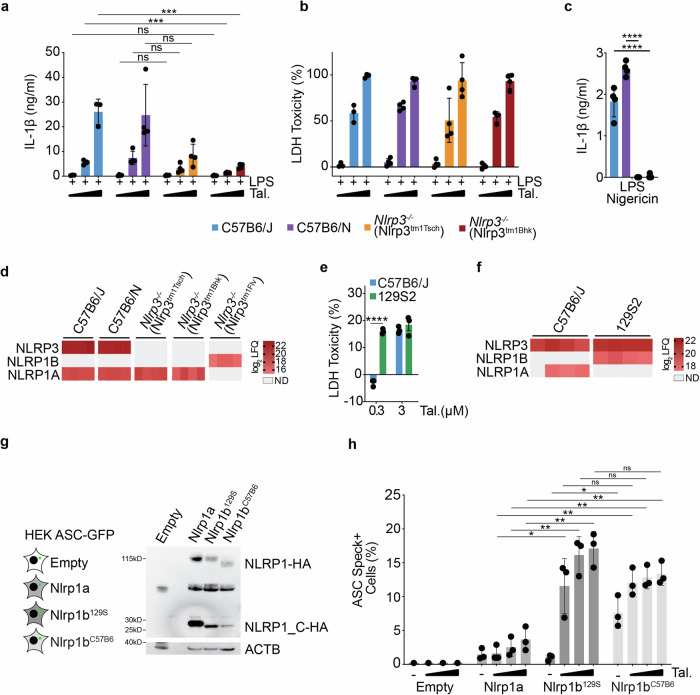
Fig. 5. Presence and expression of the NLRP1129S locus, not NLRP3 deficiency, drives hypersensitivity to Talabostat.
a IL-1β release from C57B6/J, C57B6/N, Nlrp3−/− (Nlrp3tm1Tsch) and Nlrp3−/− (Nlrp3tm1Bhk) BMDMs stimulated with LPS (10 ng/ml) and Talabostat (0.3, 3 or 30 μM) for 24 h (C57B6/J, n = 3, C57B6/N, Nlrp3tm1Tsch and Nlrp3tm1Bhk, n = 4). b LDH release relative to total lysis controls from C57B6/J, C57B6/N, Nlrp3−/− (Nlrp3tm1Tsch) and Nlrp3−/− (Nlrp3tm1Bhk) BMDMs stimulated with LPS (10 ng/ml) and Talabostat (0.3, 3 or 30 μM) for 24 h (C57B6/J, n = 3, C57B6/N, Nlrp3tm1Tsch and Nlrp3tm1Bhk, n = 4). c IL-1β release from C57B6/J, C57B6/N, Nlrp3−/− (Nlrp3tm1Tsch) and Nlrp3−/− (Nlrp3tm1Bhk) BMDMs primed with LPS (10 ng/ml) for 3 h and then stimulated with Nigericin (8 μM) for 90 min (n = 4). d Heatmap of log2 LFQ values of NLRP3, NLRP1B and NLRP1A proteins from C57B6/J, C57B6/N, Nlrp3−/− (Nlrp3tm1Tsch) and Nlrp3−/− (Nlrp3tm1Bhk) BMDMs stimulated with LPS (10 ng/ml) for 24 h (n = 4). Grey spaces indicate samples where proteins were not detected (ND). e LDH release, relative to total lysis controls, from C57B6/J and 129S2 BMDMs after stimulation with Talabostat (0.3 or 3 μM) for 24 h (n = 3). f Heatmap of log2 LFQ values of NLRP3, NLRP1B and NLRP1A proteins from C57B6/J and 129S2 BMDMs. Grey spaces indicate samples where proteins were not detected (ND). g Western blot analysis of C-terminal HA tagged NLRP1A, NLRP1B129S and NLRP1BC57B6 expression in HEK ASC-GFP cells. h Bar plot showing % of ASC speck positive HEK ASC-GFP cells empty or either stably expressing NLRP1A, NLRP1B129S or NLRP1BC57B6 stimulated with Talabostat (0.3, 3 or 30 μM) for 16 h (NLRP1A, NLRP1B129S, NLRP1BC57B6: n = 3, Empty: n = 1). a–h P values were calculated using multiple unpaired parametric t-tests. FDR (q) was calculated using Benjamini–Hochberg correction. *q < 0.05, **q < 0.01, ***q < 0.001, ****q < 0.0001, ns not significant (q > 0.05). Error bars represent standard deviation.

