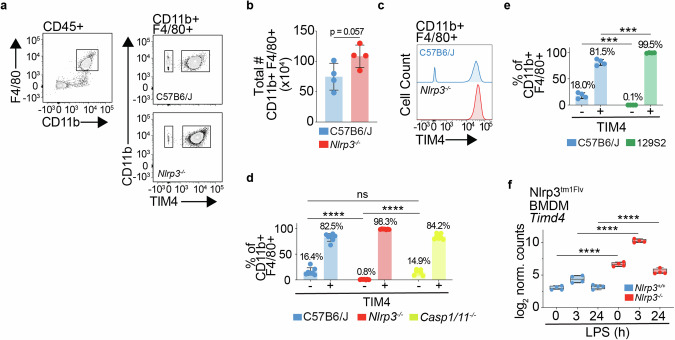
Fig. 6. Monocyte-derived peritoneal macrophages from Nlrp3tm1Flv mice overexpress TIM4.
a Representative flow cytometry plots showing identification of TIM4− and TIM4+ macrophages (F4/80+ CD11b+) in C57B6/J and Nlrp3−/− (Nlrp3tm1Flv) mouse peritoneum. Cells were pre-gated on single, live and CD45+ populations. b Bar plot of the total number of macrophages (CD11b+ F4/80+) in each peritoneum of each mouse (Nlrp3−/−, n = 4; C57B6/J, n = 4). P value was calculated using an unpaired t-test. Error bars represent standard deviation. c Representative histogram of distribution of TIM4− and TIM4+ macrophages (F4/80+ CD11b+) in C57B6/J and Nlrp3−/− (Nlrp3tm1Flv) mouse peritoneum. d Bar plot of TIM4− and TIM4+ macrophages (F4/80+ CD11b+) in C57B6/J, Nlrp3−/− (Nlrp3tm1Flv) and Casp1/11−/− mouse peritoneum. Percentages above bars show the mean value for each group. (Nlrp3−/−, n = 7; C57B6/J, n = 7; Casp1/11−/−, n = 8). Adj. P values were calculated using a two-way ANOVA with Turkey’s multiple comparison testing. *adj. P < 0.05, **adj. P < 0.01, ***adj. P < 0.001, ****adj. P < 0.0001, ns not significant (adj. P > 0.05). Error bars represent standard deviation. e Bar plot of TIM4− and TIM4+ macrophages (F4/80+ CD11b+) in C57B6/J and 129S2 mouse peritoneum. Percentages above bars show the mean value for each group (C57B6/J, n = 4; 129S2, n = 4). P values were calculated using multiple unpaired parametric t-tests. FDR (q) was calculated using Benjamini–Hochberg correction. *q < 0.05, **q < 0.01, ***q < 0.001, ****q < 0.0001, ns not significant (q > 0.05). Error bars represent standard deviation. f log2 normalised counts of Timd4 from RNAseq of Nlrp3−/− and Nlrp3+/+ (Nlrp3tm1Flv) BMDMs at baseline and after 3 and 24 h of LPS (10 ng/ml) stimulation (Nlrp3−/−, n = 4; Nlrp3+/+, n = 4). *adj. P < 0.05, **adj. P < 0.01, ***adj. P < 0.001, ****adj. P < 0.0001, ns not significant. Wald Test, Benjamini–Hochberg corrected.

