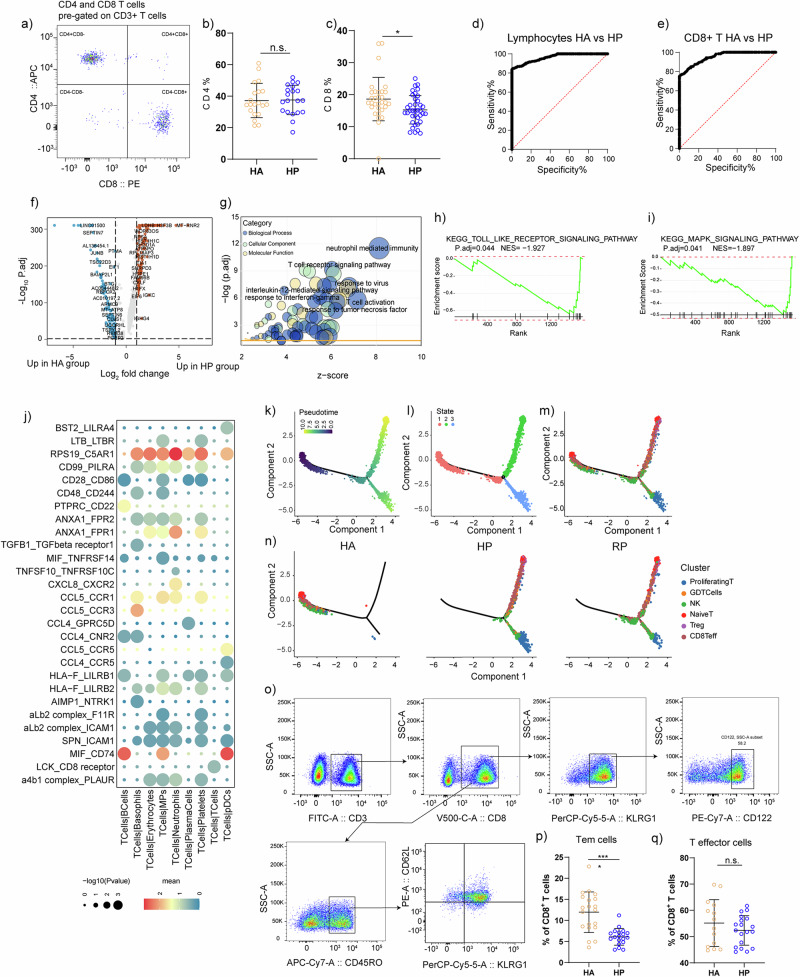
Fig. 5. Validation for CD8+ T cell subpopulations.
a Representative cytometric gating strategy for identification of T lymphocytes. b Proportion of peripheral CD4 T cell in HP and HA groups. c Proportion of peripheral CD8 T cell in HP and HA groups. d ROC curve for CD3+ T lymphocyte to separate hp from HA. AUC = 0.96. AUC, area under curve. e ROC curve for CD8+ T lymphocyte to separate hp from HA. AUC = 0.95. AUC, area under curve. f Volcano plot for comparison of HP vs. HA group in CD8 Teff cluster. g Bubble chart for GO enrichment analysis of the DEGs of CD8 Teff cluster upregulated in HP patients. P value was derived by a hypergeometric test. h GSEA plot for selected pathway positively enriched in CD8+ Teff cell cluster. i GSEA plot for selected signaling pathway positively enriched in CD8+ Teff cell cluster. j Heatmaps showing the top 30 cell–cell interactions in the scRNA-seq dataset of T cells, as inferred by CellPhoneDB. k–m Pseudotime trajectories to show the alignment of neutrophil subpopulations. Cells were colored by Pseudotime (k) subpopulation (l) or time (m). o Representative cytometric gating strategy for identification of CD8+ T lymphocytes. p Proportion of peripheral CD8 Tem cells in HP and HA groups. q Proportion of peripheral CD8 Teff cells in HP and HA groups.

