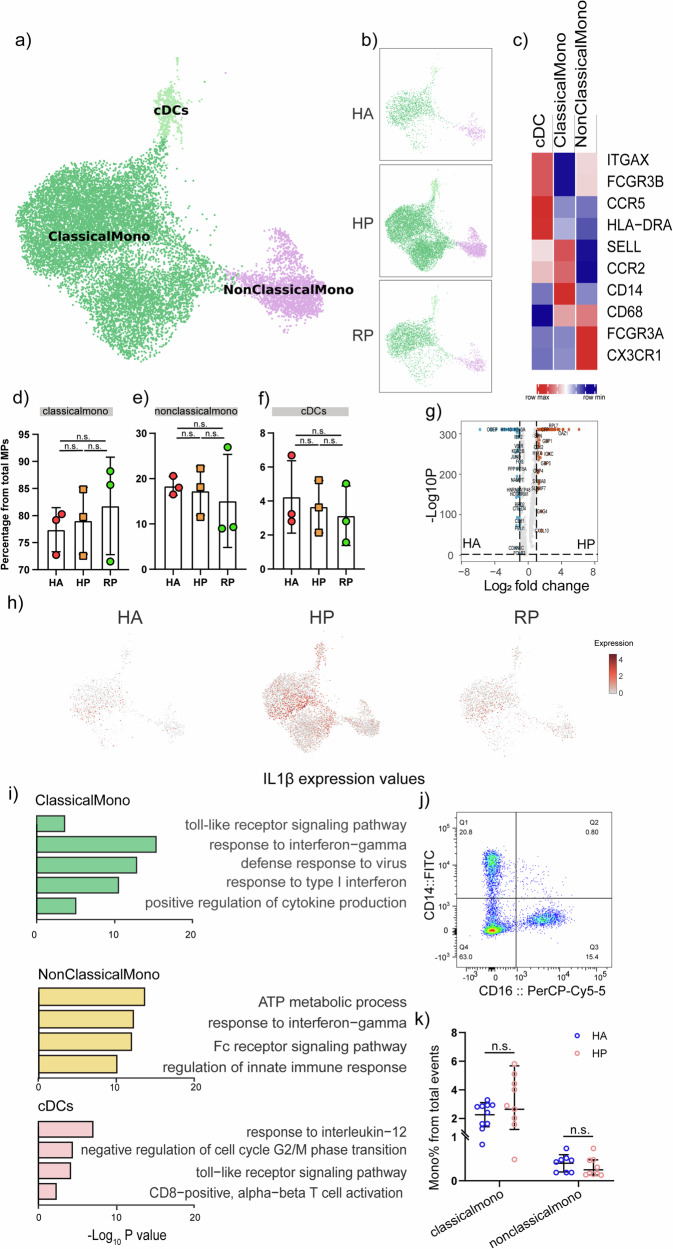
Fig. 7. Myeloid cell subsets and their states in the blood of patients with herpes zoster.
a Three clusters of myeloid cells were displayed according to marker gene expression levels. Uniform manifold approximation and projection (UMAP) presentation of the heterogeneous clusters of peripheral myeloid cells, Classical CD14++CD16− monocytes, non-classical CD14+CD16++ monocytes and cDCs. b The UAMP plot shows the distribution of the eight subpopulations across HA, HP and RP group. c Heatmap of subtype-specific marker genes of myeloid cells, including ITGAX, FCGR3B, CCR5, HLA-DRA, SELL, CCR2, CD14, CD68, FCGR3A and CX3CR1. d Box diagram of the relative frequencies of classical monocyte across HA, HP and RP group. e Box diagram of the relative frequencies of nonclassical monocyte across HA, HP and RP group. f Box diagram of the relative frequencies of cDCs across HA, HP and RP group. g Volcano plot for comparison of HP vs. HA group in classical monocyte cluster. h The UAMP plot shows that IL-1β was highly expressed in the HP patients compared with the RP patients and HCs in MPs. i GO BP enrichment analysis of the DEGs of the three subpopulations upregulated in HP patients. P value was derived by a hypergeometric test. j Representative cytometric gating strategy for identification of classical monocytes and nonclassical monocytes. k Proportion of peripheral classical monocytes and nonclassical monocytes in HP and HA groups.

