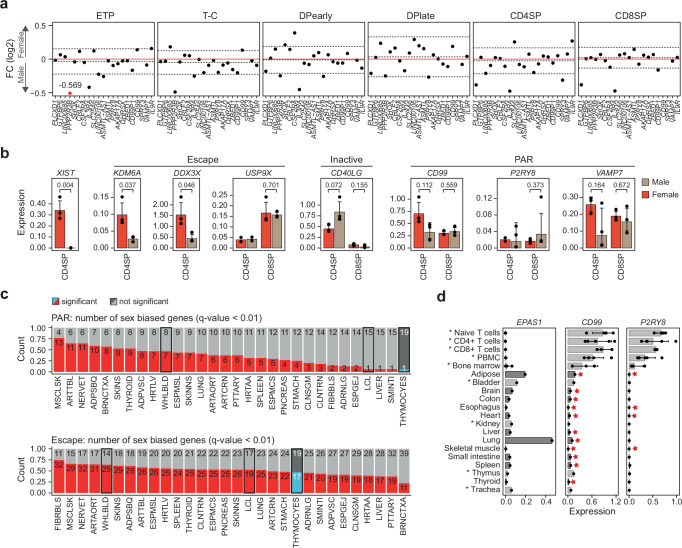
Fig. 2. Unique expression of PAR genes in human thymocytes.
a Sex-biased expression of genes in the pseudoautosomal region (PAR) as log2 fold change (FC) in the six thymocyte subpopulations. Dashed lines indicate median ± IQR for each cell type. Red dots represent FC (log2) values outside the −0.5:0.5 range that were capped to −0.5 or 0.5 FC (log2) with exact values indicated for each capped data point. ETP, early T cell progenitors; T-C, T cell committed thymocytes; DPearly, early double positive thymocytes; DPlate, late double positive thymocytes; CD4SP, CD4 single positive thymocytes; CD8SP, CD8 single positive thymocytes. b Expression in male (brown) and female (red) CD4 and CD8 single positive (SP) thymocytes of a selection of escape, inactive and PAR genes analyzed by qPCR normalized to GAPDH. Bars indicate mean expression of biological replicates and hinges standard deviation. P-values comparing expression in males and females indicated above; unpaired, two-tailed student t-test. Standard deviation and p-value only shown where 3 biological replicates were available in each group. c Number of significant sex-biased PAR (upper) and escape genes (lower) in 30 different tissues, comparing thymocytes to GTEx data processed in Tukiainen et al.10. Statistical significance for thymocytes: Wald test (BH corrected) P-value < 0.01, for GTEx data eBayes FDR < 0.01. Hematopoietic samples (whole blood, EBV-transformed lymphocytes and thymocytes) are highlighted. Tissue abbreviations can be found in Supplementary Table 3. d Gene expression of EPAS1, CD99 and P2RY8 across an independent set of 20 tissues analyzed by qPCR and normalized to GAPDH expression. Bars indicate mean expression and hinges standard deviation. Stars highlight tissues that have previously been shown to be sex-biased10. Asterix and different nuances of gray depict tissues that were included (dark gray) or were not included (light gray, asterisk) in the analysis of sex-biased expression in GTEx shown in panel c. PBMC, peripheral blood mononuclear cells. Source data are provided as a Source Data file.

